Dear Experts,
I have been experimenting with the plot_dates option of matplotlib to plot time series data and have below questions
I have used
loc = mdates.AutoDateLocator()
ax.xaxis.set_major_locator(loc)
ax.xaxis.set_major_formatter(mpl.dates.DateFormatter('%b\n %Y'))
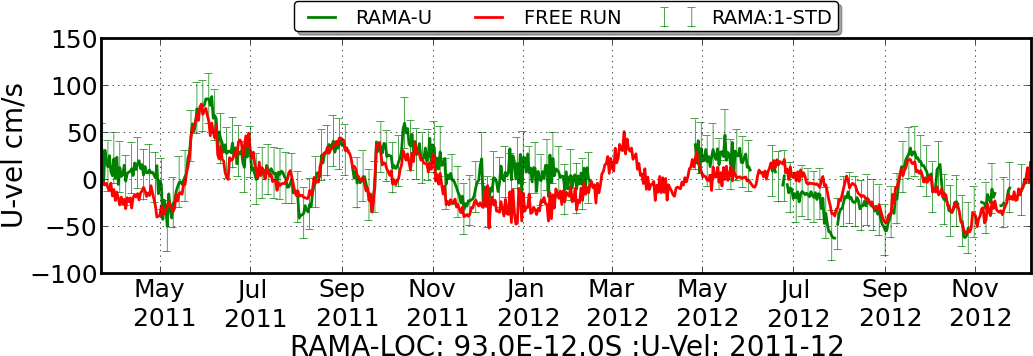
and got the tick labels in attached plot
However I feel the repeatd year labeling is not needed here and it is required once in a year only , Also if I need to plot long time seris insted of "MAR" "APR" I wanted to get them reduced to "M" "A" etc so that the lavel congestion can be avoided.
I notice that below options are available, but was wondering how commbinatins of these locateors are used ie mark every month and every year once each.
Is there a way to achive the above or does it need further development?
fmt = mdates.DateFormatter('%Y-%m-%d')
loc = mdates.WeekdayLocator(byweekday=mdates.MONDAY,interval=4)
locator = mdates.YearLocator()
with best regards,
Sudheer
···
***************************************************************
Sudheer Joseph
Indian National Centre for Ocean Information Services
Ministry of Earth Sciences, Govt. of India
POST BOX NO: 21, IDA Jeedeemetla P.O.
Via Pragathi Nagar,Kukatpally, Hyderabad; Pin:5000 55
Tel:+91-40-23886047(O),Fax:+91-40-23895011(O),
Tel:+91-40-23044600(R),Tel:+91-40-9440832534(Mobile)
E-mail:sjo.India@...287...;sudheer.joseph@...9...
Web- http://oppamthadathil.tripod.com
***************************************************************
If I were trying to do this, I'd cobble something together using by the
minor and major formatters.
e.g.,...
import matplotlib.dates as mdates
import matplotlib.pyplot as plt
fig, ax = plt.subplots()
majorLocs = mdates.MonthLocator(bymonth[1,7])
majorFmt = mdates.DateFormatter('%b\n%Y')
minorLocs = mdates.MonthLocator(bymonth[1,7])
minorFmt = mdates.DateFormatter('%b')
ax.xaxis.set_major_locator(majorLocs)
ax.xaxis.set_major_formatter(majorFmt)
ax.xaxis.set_minor_locator(minorLocs)
ax.xaxis.set_minor_formatter(minorFmt)
···
On Thu, Jun 6, 2013 at 11:39 PM, Sudheer Joseph <sudheer.joseph@...9...>wrote:
Dear Experts,
I have been experimenting with the plot_dates option of
matplotlib to plot time series data and have below questions
I have used
loc = mdates.AutoDateLocator()
ax.xaxis.set_major_locator(loc)
ax.xaxis.set_major_formatter(mpl.dates.DateFormatter('%b\n %Y'))
and got the tick labels in attached plot
However I feel the repeatd year labeling is not needed here and it is
required once in a year only , Also if I need to plot long time seris
insted of "MAR" "APR" I wanted to get them reduced to "M" "A" etc so that
the lavel congestion can be avoided.
I notice that below options are available, but was wondering how
commbinatins of these locateors are used ie mark every month and every year
once each.
Is there a way to achive the above or does it need further development?
fmt = mdates.DateFormatter('%Y-%m-%d')
loc = mdates.WeekdayLocator(byweekday=mdates.MONDAY,interval=4)
locator = mdates.YearLocator()