Hello,
How is it possible to increase the space between xticks in the following code:
from pylab import *
import matplotlib.pyplot as plt
y1 = [20, 24, 8, 4, 12, 22, 31, 25, 15, 28, 12, 27, 22, 22, 27, 14, 32, 28, 8, 17, 2, 8, 29, 13, 14, 20, 11, 28, 8]
y2= [2, 32, 28, 1, 22, 11, 14, 27, 3, 31, 12, 20, 32, 24, 24, 16, 7, 10, 12, 11, 3, 32, 10, 20, 14, 14, 3, 25, 14]
point_labels1 = ['A=1', 'A=1', 'A=1', 'A=1', 'A=1', 'A=1', 'A=1', 'A=1', 'A=1', 'A=1', 'A=1', 'A=1', 'A=1', 'A=1', 'A=1', 'A=1', 'A=1', 'A=1', 'A=1', 'A=1', 'A=1', 'A=1', 'A=1', 'A=1', 'A=1', 'A=1', 'A=1', 'A=1', 'A=1']
point_labels2 = ['B=1', 'B=1', 'B=1', 'B=1', 'B=1', 'B=1', 'B=1', 'B=1', 'B=1', 'B=1', 'B=1', 'B=1', 'B=1', 'B=1', 'B=1', 'B=1', 'B=1', 'B=1', 'B=1', 'B=1', 'B=1', 'B=1', 'B=1', 'B=1', 'B=1', 'B=1', 'B=1', 'B=1', 'B=1']
#fig = plt.figure(figsize=(40,40))
fig = plt.figure()
ax = fig.add_subplot(111)
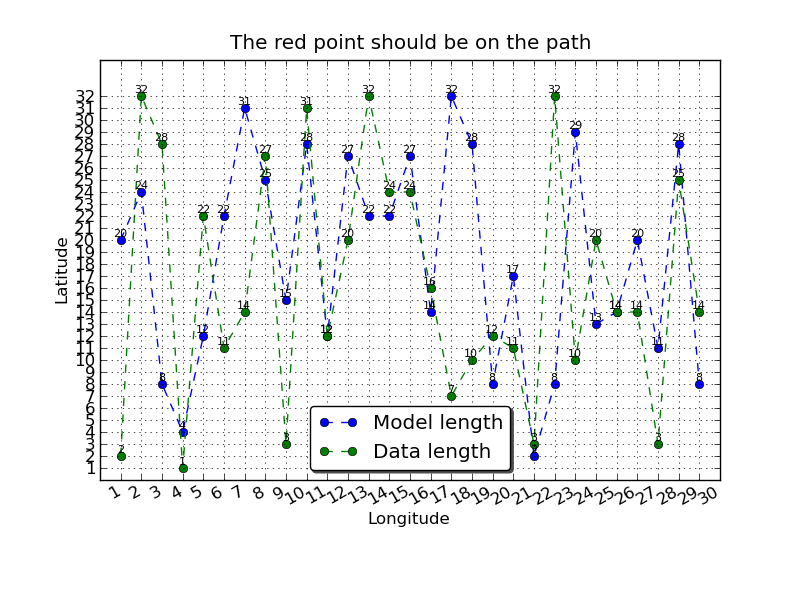
ax.set_title('The red point should be on the path')
ax.grid(True)
maxy = max(max(y1), max(y2))
maxx = max(len(y1), len(y2))
x = range(1,maxx+1)
plt.plot(x, y1, '--bo', x, y2, '--go')
# rotates and right aligns the x labels, and moves the bottom of the
# axes up to make room for them
fig.autofmt_xdate()
# set x and y labels
plt.xticks(range(1, maxx+2, 1))
#ax.set_xticks(4.5)
plt.yticks(range(1, maxy+1, 1))
plt.xlabel('Longitude')
plt.ylabel('Latitude')
plt.legend(('Model length', 'Data length'),
'best', shadow=True, fancybox=True)
for i, label in enumerate(y1):
plt.text (x[i], y1[i]+0.2, label,
horizontalalignment='center', fontsize=8 )
for i, label in enumerate(y2):
plt.text (x[i], y2[i]+0.2, label,
horizontalalignment='center', fontsize=8 )
plt.savefig('test.png')
Thank you in advance.