Tick formatting

Hello,

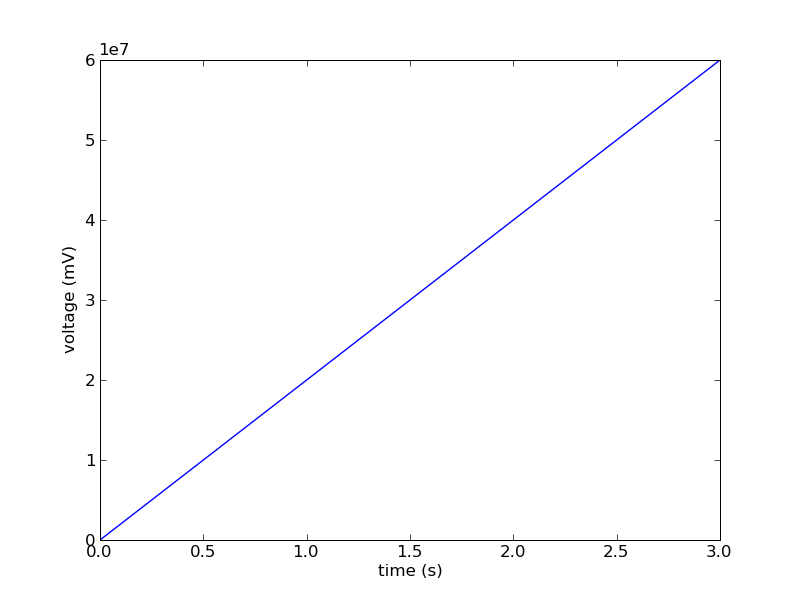
Using the following simple script, the scientific notation used on the y-axis is missing a multiplication symbol, as seen in the figure. My matplotlibrc file consists of

backend : GTKAgg

and I am using SVN r6760.

I found this when I was trying to change the ScalarFormatter to have useMathText = True by default, so the scientific notation would use a superscript and not '1e7'.

Paul Novak

default.png

···

---
import matplotlib.pyplot as plt
import numpy as np

t = np.arange(0.0, 4.0)
s = 2.0e7*t
plt.plot(t, s, linewidth=1.0)

plt.xlabel(r'time (s)')
plt.ylabel('voltage (mV)')
plt.show()

I think this is just historical, since matplotlib never used to rely on having proper Unicode character rendering in all backends. (And displaying a multiplication symbol, rather than just * or x requires non-ascii). I believe that is no longer a problem these days, so we could change it to display a multiplication symbol.

This doesn't appear to be a regression from an earlier version. Was that what you're implying?

All that said, this raises another question -- we should probably make it easier to set useMathText to True in the ScalarFormatter, either through an rcParam or a kwarg somewhere. As it stands, it appears (unless my grepping search has been wrong) the only way to get this behavior is by modifying the matplotlib source. Not ideal :wink:

Mike

Paul Novak wrote:

···

Hello,

Using the following simple script, the scientific notation used on the y-axis is missing a multiplication symbol, as seen in the figure. My matplotlibrc file consists of

backend : GTKAgg

and I am using SVN r6760.

I found this when I was trying to change the ScalarFormatter to have useMathText = True by default, so the scientific notation would use a superscript and not '1e7'.

Paul Novak

---
import matplotlib.pyplot as plt
import numpy as np

t = np.arange(0.0, 4.0)
s = 2.0e7*t
plt.plot(t, s, linewidth=1.0)

plt.xlabel(r'time (s)')
plt.ylabel('voltage (mV)')
plt.show()

------------------------------------------------------------------------

------------------------------------------------------------------------

------------------------------------------------------------------------------
Check out the new SourceForge.net Marketplace.
It is the best place to buy or sell services for
just about anything Open Source.
http://p.sf.net/sfu/Xq1LFB
------------------------------------------------------------------------

_______________________________________________
Matplotlib-users mailing list
Matplotlib-users@lists.sourceforge.net
matplotlib-users List Signup and Options
  
--
Michael Droettboom
Science Software Branch
Operations and Engineering Division
Space Telescope Science Institute
Operated by AURA for NASA

I don't think this is a regression; I guess what I was looking for was an rcParam or a kwarg to set useMathText. Would it make sense to set useMathText=True by default?

Thanks,
Paul

Michael Droettboom wrote:

···

I think this is just historical, since matplotlib never used to rely on having proper Unicode character rendering in all backends. (And displaying a multiplication symbol, rather than just * or x requires non-ascii). I believe that is no longer a problem these days, so we could change it to display a multiplication symbol.

This doesn't appear to be a regression from an earlier version. Was that what you're implying?

All that said, this raises another question -- we should probably make it easier to set useMathText to True in the ScalarFormatter, either through an rcParam or a kwarg somewhere. As it stands, it appears (unless my grepping search has been wrong) the only way to get this behavior is by modifying the matplotlib source. Not ideal :wink:

Mike

Paul Novak wrote:

Hello,

Using the following simple script, the scientific notation used on the y-axis is missing a multiplication symbol, as seen in the figure. My matplotlibrc file consists of

backend : GTKAgg

and I am using SVN r6760.

I found this when I was trying to change the ScalarFormatter to have useMathText = True by default, so the scientific notation would use a superscript and not '1e7'.

Paul Novak

---
import matplotlib.pyplot as plt
import numpy as np

t = np.arange(0.0, 4.0)
s = 2.0e7*t
plt.plot(t, s, linewidth=1.0)

plt.xlabel(r'time (s)')
plt.ylabel('voltage (mV)')
plt.show()

Hello,

I am having some problems with the PS backend. I used the following
script to create a PostScript file

#!/usr/bin/env python
import matplotlib
matplotlib.use('PS')
import matplotlib.pyplot as plt
import numpy

x1 = numpy.arange(0,5)
y1 = x1
plt.plot(x1, y1)
plt.savefig('image.ps')
plt.show()

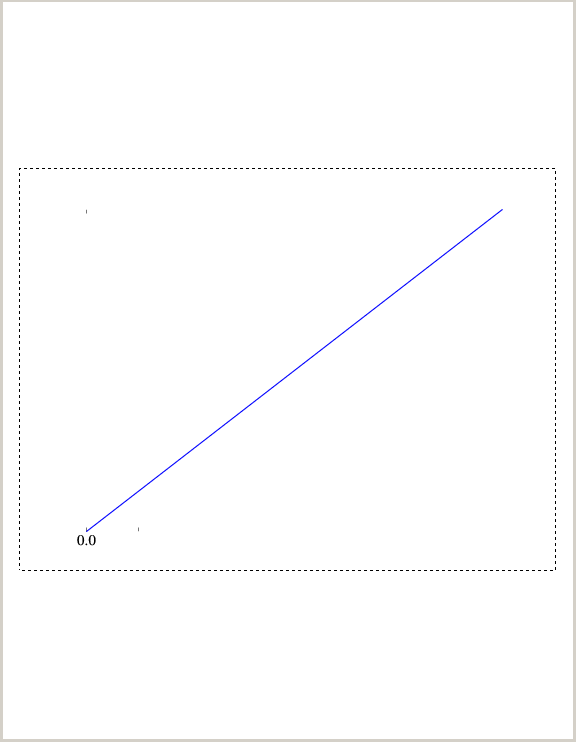
When I tried to open the PostScript file in GSview, there is the
following warning, and the file does not render properly. I have
attached the PostScript file and a screenshot of the incorrect rendering.

DSC Error
At line 233:
    %%Page: 1 1
This %%Page: line occurred in the trailer, which is not legal.
EPS files should be encapsulated in %%BeginDocument / %%EndDocument.
If is possible that an EPS file was incorrectly encapsulated,
and that we have been confused by the %%Trailer in an EPS file.

The error can be eliminated by removing the line with %%EOF at line 230,
and adding %%Trailer after line 1024, but I don't know anything about
PostScript or if those changes would have any other effects. I only
found this solution after comparing with the output from the Cairo
backend. The same change to PostScript output can be achieved with the
following diff (from svn diff), but again, I don't know if it is
appropriate.

Index: lib/matplotlib/backends/backend_ps.py
screenshot.png

ps_backend.ps (13.6 KB)

···

===================================================================
--- lib/matplotlib/backends/backend_ps.py (revision 6760)
+++ lib/matplotlib/backends/backend_ps.py (working copy)
@@ -1006,6 +1006,7 @@
           #print >>fh, "grestore"
           print >>fh, "end"
           print >>fh, "showpage"
+ print >>fh, "%%Trailer"
           if not isEPSF: print >>fh, "%%EOF"
           fh.close()

Index: ttconv/pprdrv_tt.cpp

--- ttconv/pprdrv_tt.cpp (revision 6760)
+++ ttconv/pprdrv_tt.cpp (working copy)
@@ -1070,7 +1070,6 @@
         } /* end of if Type 42 not understood. */

       stream.putline("FontName currentdict end definefont pop");
- stream.putline("%%EOF");
       } /* end of ttfont_trailer() */

   /*------------------------------------------------------------------

Paul Novak