import pandas as pd
import matplotlib.pyplot as plt
import numpy as np
df=pd.DataFrame('sum.txt')
fig, axs = plt.subplots(6,2,figsize=(9, 15), facecolor='w', edgecolor='k')
#fig.subplots_adjust(hspace = .5, wspace=.001)
axs = axs.ravel()
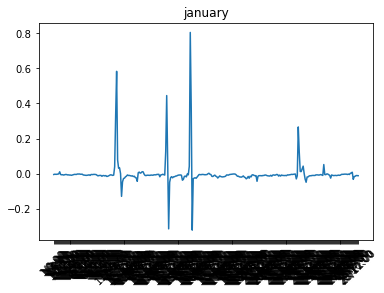
for i in range(0,12):
axs[i].plot(fn.loc[fn['mm']==i+1]['dd/tt'],fn.loc[fn['mm']==i+1]['BRIG'])