Hello List,
I am so far happy with the output form matplotlib, but I recently started annotating my plots, and when saving to png-format, the annotations do not look very nice. When saving to eps format, I do not see the same problems.
Saving to eps and converting to png seems to be a good workaround for me.
The problem is that the letters in the same word (on the same line) are not aligned, some are drawn to far up or down.
png and eps figures are attached. Example script and version number (0.99.0) below.
Am I misusing matplotlib? Is this a bug?
Regards
johan
Minimal example:
pyplot_text.eps (29.2 KB)
···
-----------------------
import matplotlib.pyplot as plt
import numpy as np
plt.figure()
x = [0]
plt.plot(x, x)
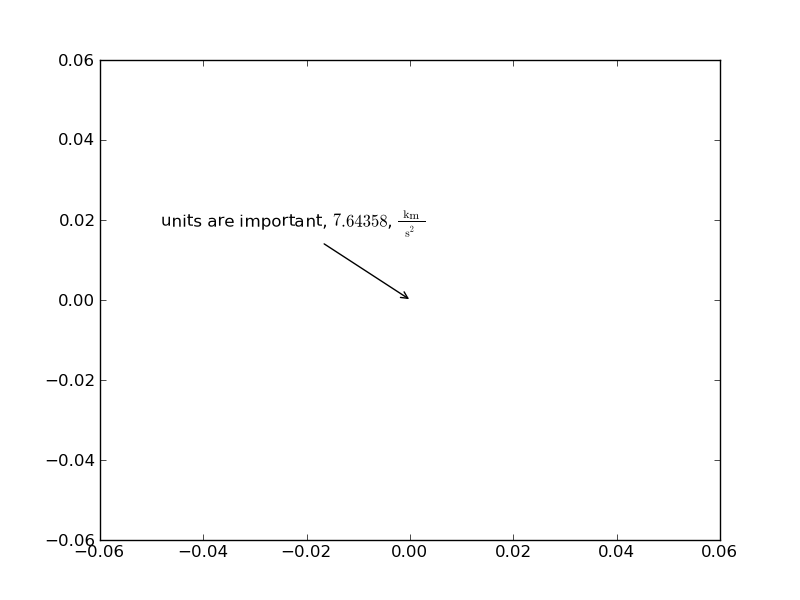
plt.annotate("units are important, $7.64358$, $\\frac{\mathrm{k}\mathrm{m}}{\mathrm{s^2}}$",
xy = (0,0),
xycoords = "data",
xytext = (0.2, 0.6),
textcoords = "figure fraction",
arrowprops = dict(arrowstyle = "->",
connectionstyle = "arc"))
plt.savefig("pyplot_text.png")
plt.savefig("pyplot_text.eps")
plt.show()
-----------------------
Expected result: An empty plot with a nice annotation on screen, in a png-file, and in an eps-file
Result: Empty plots with annotation displaying differently in the three cases. In the png file, the letters u and r and the digit 7 appear slightly above the correct position, and the m in the unit km appears slightly below the correct position. In the screen output, the m is correct, but the u and r show the same problem as in the png file. In the eps file, all seems to be well.
My os is debian (testing), and I obtain matplotlib and all related software from the debian repositories.
johan@...2848...:~$ uname -a
Linux johan-laptop 2.6.30-2-amd64 #1 SMP Fri Sep 25 22:16:56 UTC 2009 x86_64 GNU/Linux
johan@...2848...:~$ python -c "import matplotlib; print matplotlib.__version__"
0.99.0