I wanted to see the output of the surface plot and wanted to be able to move it around, so that I don’t have to set a fixed elevation and azimuth. Though I eventually was able to get the output but it’s super slow, not able to move it that seamlessly and thinking that it’s the issue with my machine’s processing power, I thought of running same thing on Google colab… doesn’t seem to be working there. Any idea folks what’s the issue?
Code is following(you can use any image having a face):
    import cv2
    from mpl_toolkits.mplot3d import Axes3D
    from matplotlib import pyplot as plt
    import numpy as np
    %matplotlib notebook

    img = cv2.imread('74113_v9_bb.jpg', 0)
    x, y = np.mgrid[0:img.shape[0], 0:img.shape[1]]
    fig = plt.figure(figsize=(11, 11))
    ax = fig.gca(projection='3d')
    ax.plot_surface(x, y, img, rstride=1, cstride=1, cmap=plt.cm.gray, linewidth=1)
    ax.view_init(90, 30)
    plt.show()
All I am trying to do is to create a pixel intensity of a grayscale image as a surface plot.
Input image(link):
Output image(not the interactive plot):
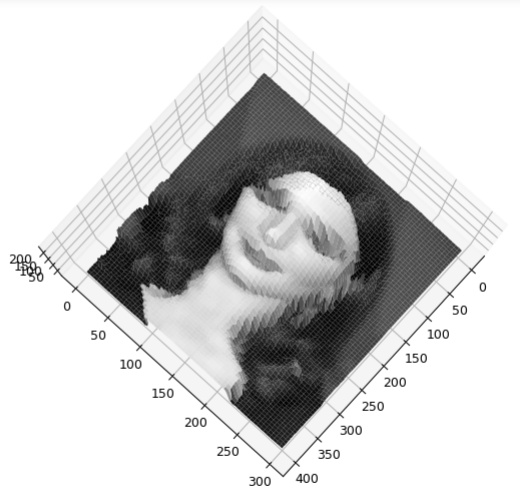
So I got the result but it’s super slow. Can anyone explain why?
By setting the rstride and cstride to 1 you are drawing a ~4 line segments for each pixel so there is quite a bit of computation that is being done (much of which is not super useful because it looks like that images has significantly more pixels than your final output). I suggest increasing the strides and it will feel much snappier.
Additionally, if the compute is happening on a remote server there can be noticeable latency from the communication between the JS front end and the kernel (mouse event in browser -> msg to kernel -> process rotation -> re-draw figure -> ship image back to browser).
1 Like
Well I did change that and yes it became a bit snappier but increasing the numbers made the output more pixelated as well. Can you explain a bit what exactly is happening and what are these rstride and cstride parameters exactly? Stride if am not wrong is how many steps to move and I guess c and r at the start has something to do with the direction, what I am actually asking is, how their numbers equivalent to line segments for each pixel? You lost me there for a bit.
Please see https://matplotlib.org/api/_as_gen/mpl_toolkits.mplot3d.axes3d.Axes3D.html?highlight=plot_surface#mpl_toolkits.mplot3d.axes3d.Axes3D.plot_surface for the full description of the parameters to plot_surface. You can also access the docstring via help(ax.plot_surface) in the prompt (or ? ax.plot_surface in IPython).
If the strides are 1, that means you draw line segments between every pixel.
1 Like