Adam,
I needed a same thing a while ago and I ended up with a custom class.
Although this need some more work, try and see if it fits your need in
case you want to avoid the little arithmetic that John mentioned.
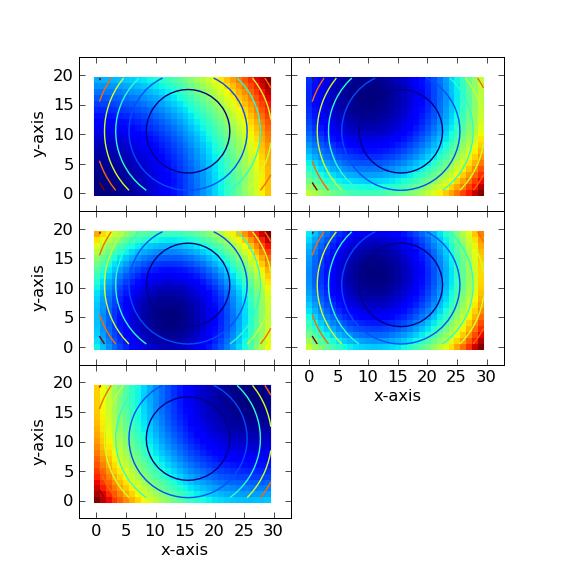
The python file and a example plot are attached.
I wanted the padding between the subaxes is conserved even if the
figure size changes (and something more), so the implementation got
little bit hackish and much longer than I initially expected, but it
works for me.
A simple use case is included in the file (I’m afraid that there are
not much documentation).
Briefly,
import matplotlib.pyplot as plt
from mpl_multiaxes import MultiPane_Subplot
F = plt.figure(1)
F.clf()
mp = MultiPane_Subplot(F, subplot_pos=(1, 1, 1),
                   nrows_ncols = (3, 2),

                   n_pane=5,

                   pane_direction="row", # or "column"

                   axes_pad_inch=0.0,

                   )
F.add_subplot(mp)
In the above example, MultiPane_Subplot is a subclass of the Subplot
which contains subaxes. You set number of rows and columns for your
subaxes grid. If the number of subaxes is smaller than nrows*ncols,
you explicitly set it with n_pane.
After this, each subaxes is accessed as mp[0], mp[1], and so on. They
are subclass of Axes. So you may use any drawing method that Axes
class has. As mp is subclass of Subplot, it is also an axes. I
consider it as a kind of master axes. Anything you plot in this axes
is also drawn in all of its subaxes. Also note that xaxis and yaxis
are shared among these subaxes, therefore they have same xlim, ylim.
etc.
Regards,
-JJ