This is probably the best route to go down as you can do other interesting
things as the event goes by (like triggering computation, updating a openGL
view window, etc) as well as updating the Matplotlib limits.
Tom
···
On Mon, May 15, 2017 at 3:29 AM Juan Nunez-Iglesias <jni.soma at gmail.com> wrote:
Thanks for that response, it was just what I needed! I had a fun infinite loop where the x-axis was updating the y-axis which was updating the x-axis which... =P But it was easy enough to sort out. =)
I have a working orthogonal slice viewer here:
The problem I have now is that, if I set a mouse-click callback (this line and this line), and then I select any other tool from the toolbar, I get this super-obnoxious flickering, recorded here (macOS 10.12, Tk backend):
To reproduce:
- Download slice_view.py and put it in your PYTHONPATH or current working directory
- Download this example dataset:
- Run this code:
v = sv.SliceViewer(image, spacing=[5, 1, 1])
matplotlib.pyplot.show(block=True)
Questions:
1) Any ideas about how to fix the flickering?
2) Is there a cross-backend way to add buttons to the toolbar? All the examples I've found online were backend-specific. (This way I could at least disable the callback at will.)
Thanks!
Juan.
···
On 16 May 2017, 1:43 AM +1000, Thomas Caswell <tcaswell at gmail.com>, wrote:
There are callbacks that fire when the limits are changed.? See
This is probably the best route to go down as you can do other interesting things as the event goes by (like triggering computation, updating a openGL view window, etc) as well as updating the Matplotlib limits.
Tom
> On Mon, May 15, 2017 at 3:29 AM Juan Nunez-Iglesias <jni.soma at gmail.com> wrote:
> > Hello,
> >
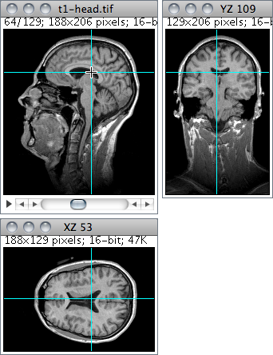
> > I?m trying to build an orthogonal-views volume viewer in Matplotlib like this one:
> > https://imagej.nih.gov/ij/docs/guide/images/OrthogonalViews.png
> >
> > For this to work, I need to share the y-axis of the YZ (right) view/subplot with the x-axis of the XZ (bottom) view/subplot. Is this possible?
> >
> > Juan.
> >
> > _______________________________________________
> > Matplotlib-users mailing list
> > Matplotlib-users at python.org
> > Matplotlib-users Info Page
re: cross-backend way to add buttons: There is experimental feature called
"ToolManager", but I think it is only implemented for a couple of backends
currently. You can see an example here:
On Fri, Jun 23, 2017 at 12:17 AM, Juan Nunez-Iglesias <jni.soma at gmail.com> wrote:
Hey Tom,
Thanks for that response, it was just what I needed! I had a fun infinite
loop where the x-axis was updating the y-axis which was updating the x-axis
which... =P But it was easy enough to sort out. =)
Questions:
1) Any ideas about how to fix the flickering?
2) Is there a cross-backend way to add buttons to the toolbar? All the
examples I've found online were backend-specific. (This way I could at
least disable the callback at will.)
Thanks!
Juan.
On 16 May 2017, 1:43 AM +1000, Thomas Caswell <tcaswell at gmail.com>, wrote:
There are callbacks that fire when the limits are changed. See
This is probably the best route to go down as you can do other interesting
things as the event goes by (like triggering computation, updating a openGL
view window, etc) as well as updating the Matplotlib limits.
Tom
On Mon, May 15, 2017 at 3:29 AM Juan Nunez-Iglesias <jni.soma at gmail.com> > wrote:
Oops, revisiting this thread now, it looks like I only replied to Ben, instead of the list. Full thread below, but TL;DR: my 3D orthogonal views project:
is working (thanks to all on this list who helped so far!), but has the following problems:
- Experiences flickering when panning in the Tk backend
- Has no flickering with the MacOS backend, but then the keyboard bindings don?t work at all
- Is dog-slow in the nbagg backend.
Any suggestions to help with this would be much appreciated! To recap, here are the steps to reproduce:
- Download slice_view.py and put it in your PYTHONPATH or current working directory
- Download this example dataset:
- Run this code:
import matplotlib
matplotlib.use('TkAgg?) ?# change this to whatever you want to test
v = sv.SliceViewer(image, spacing=[5, 1, 1])
matplotlib.pyplot.show(block=True)
Thanks!
Juan.
···
---------- Forwarded message ----------
From: Juan Nunez-Iglesias <jni.soma@gmail.com>
Date: 11 Jul 2017, 12:06 PM +1000
To: Benjamin Root <ben.v.root at gmail.com>
Subject: Re: [Matplotlib-users] Subplot x-axis shared with other subplots y-axis
Hi Ben, thanks for the tip! The point of using the ToolManager would be to get cross-backend support, so it might be easier for me to implement the backends I want with if-else statements, or some other kludgey way?
I just thought I?d update the list with the status of my orthogonal views mini-project, which is backend-dependent:
- working on Tk except for the flickering
- working on macOS except the keyboard bindings don?t work ? they go straight to the Terminal.
- working on Notebook (Nbagg?), except it?s dog-slow.
If anyone has suggestions for any of these problems, I would be very grateful!
Juan.
On 28 Jun 2017, 1:08 AM +1000, Benjamin Root <ben.v.root at gmail.com>, wrote:
> re: cross-backend way to add buttons: There is experimental feature called "ToolManager", but I think it is only implemented for a couple of backends currently. You can see an example here:
>
> http://matplotlib.org/examples/user_interfaces/toolmanager.html
>
> > On Fri, Jun 23, 2017 at 12:17 AM, Juan Nunez-Iglesias <jni.soma at gmail.com> wrote:
> > > Hey Tom,
> > >
> > > Thanks for that response, it was just what I needed! I had a fun infinite loop where the x-axis was updating the y-axis which was updating the x-axis which... =P But it was easy enough to sort out. =)
> > >
> > > I have a working orthogonal slice viewer here:
> > > GitHub - jni/mpl-volume-viewer: Simple matplotlib-based volume (3D image) viewer
> > >
> > > The problem I have now is that, if I set a mouse-click callback (this line and this line), and then I select any other tool from the toolbar, I get this super-obnoxious flickering, recorded here (macOS 10.12, Tk backend):
> > > Dropbox - mpl-click-bug.mov - Simplify your life
> > >
> > > To reproduce:
> > >
> > > - Download slice_view.py and put it in your PYTHONPATH or current working directory
> > > - Download this example dataset:
> > > https://www.dropbox.com/s/dj3oarx7bqx4us2/E_z2_512_1um_CONTROL.tif?dl=1
> > > - Run this code:
> > >
> > > import matplotlib
> > > matplotlib.use('TkAgg')
> > >
> > > from skimage import io
> > > import slice_view as sv
> > >
> > > filename = '/path/to/E_z2_512_1um_CONTROL.tif'
> > > image = io.imread(filename) / 4096
> > >
> > > v = sv.SliceViewer(image, spacing=[5, 1, 1])
> > > matplotlib.pyplot.show(block=True)
> > >
> > > Questions:
> > > 1) Any ideas about how to fix the flickering?
> > > 2) Is there a cross-backend way to add buttons to the toolbar? All the examples I've found online were backend-specific. (This way I could at least disable the callback at will.)
> > >
> > > Thanks!
> > >
> > > Juan.
> > >
> > > On 16 May 2017, 1:43 AM +1000, Thomas Caswell <tcaswell at gmail.com>, wrote:
> > > > There are callbacks that fire when the limits are changed.? See
> > > >
> > > > https://matplotlib.org/examples/event_handling/viewlims.html
> > > >
> > > > for an example.
> > > >
> > > > This is probably the best route to go down as you can do other interesting things as the event goes by (like triggering computation, updating a openGL view window, etc) as well as updating the Matplotlib limits.
> > > >
> > > > Tom
> > > >
> > > > > On Mon, May 15, 2017 at 3:29 AM Juan Nunez-Iglesias <jni.soma at gmail.com> wrote:
> > > > > > Hello,
> > > > > >
> > > > > > I?m trying to build an orthogonal-views volume viewer in Matplotlib like this one:
> > > > > > https://imagej.nih.gov/ij/docs/guide/images/OrthogonalViews.png
> > > > > >
> > > > > > For this to work, I need to share the y-axis of the YZ (right) view/subplot with the x-axis of the XZ (bottom) view/subplot. Is this possible?
> > > > > >
> > > > > > Juan.
> > > > > >
> > > > > > _______________________________________________
> > > > > > Matplotlib-users mailing list
> > > > > > Matplotlib-users at python.org
> > > > > > Matplotlib-users Info Page
> > >
> > > _______________________________________________
> > > Matplotlib-users mailing list
> > > Matplotlib-users at python.org
> > > Matplotlib-users Info Page
> > >
>