I’m using streamplot to plot interpolated winds on a map.
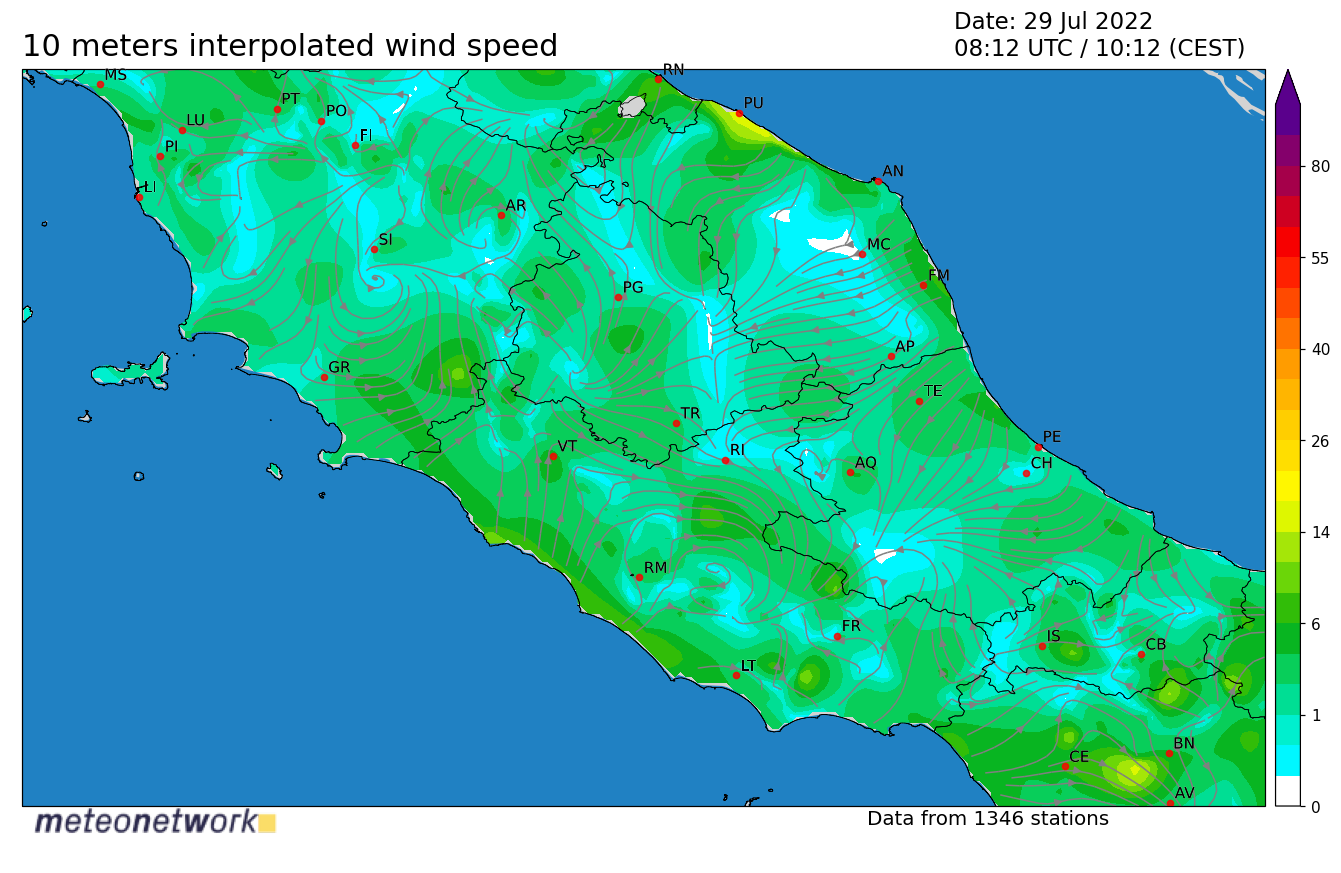
For small regions this works pretty well (note: the area of the first picture is contained in the area of the second one!)
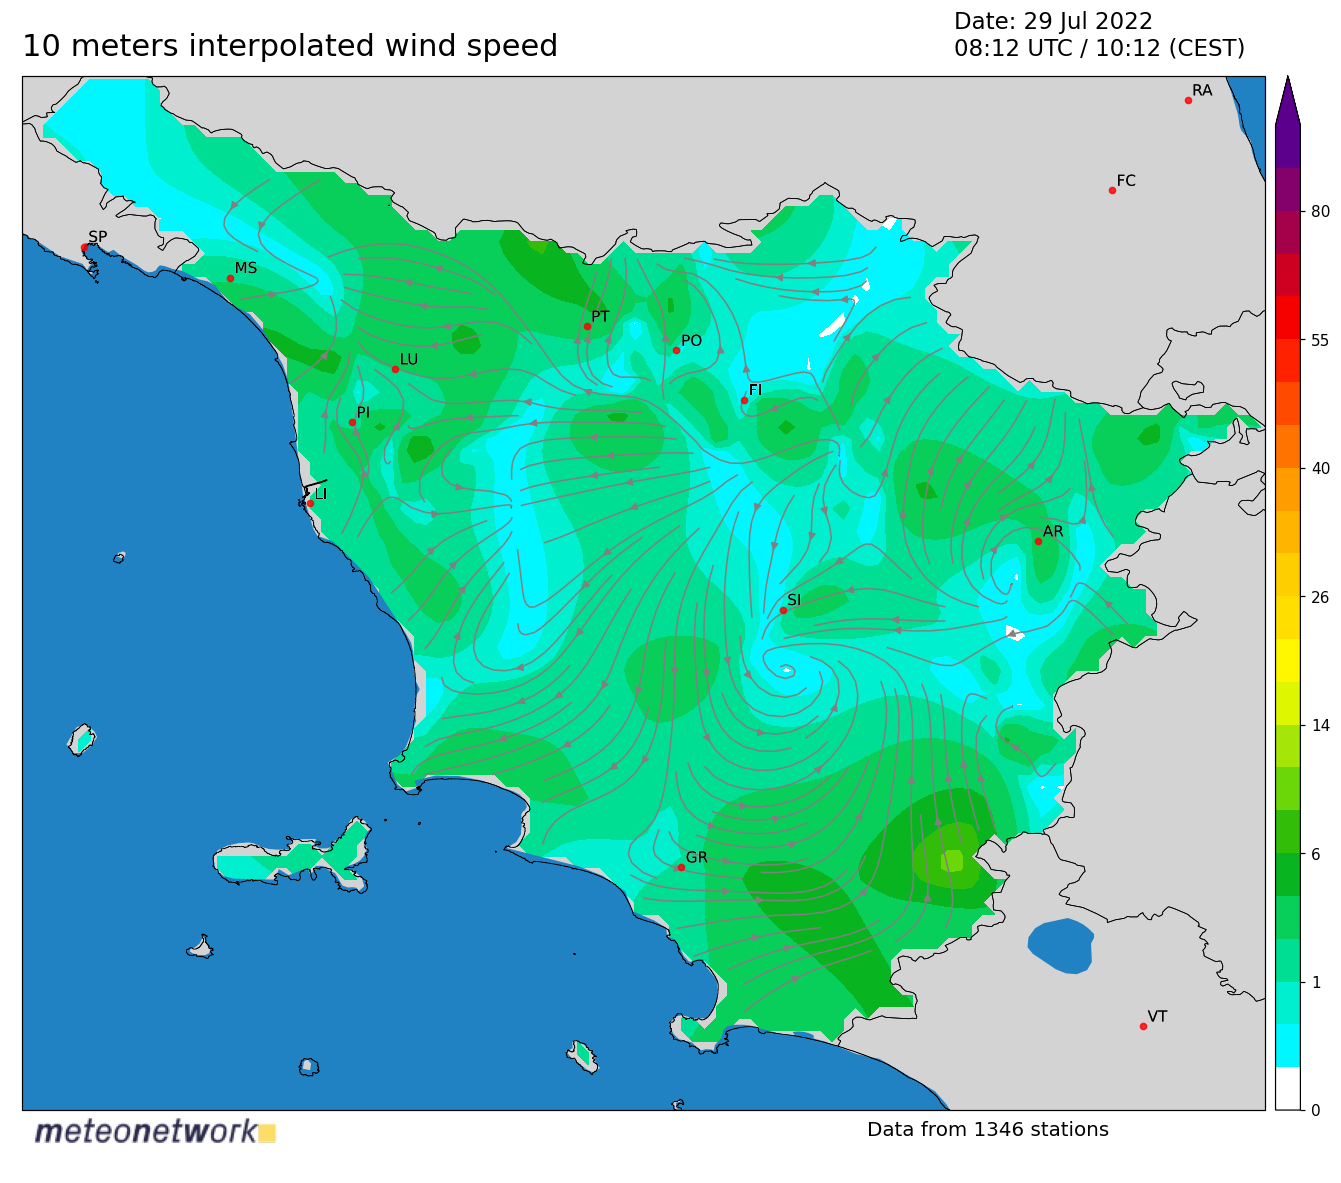
I’m using a density of 2.5 and linewidth of 1.
If I try to plot a larger domain, the entire country, it takes a while (more than 1 minute) and the resulting streamline are too sparse.
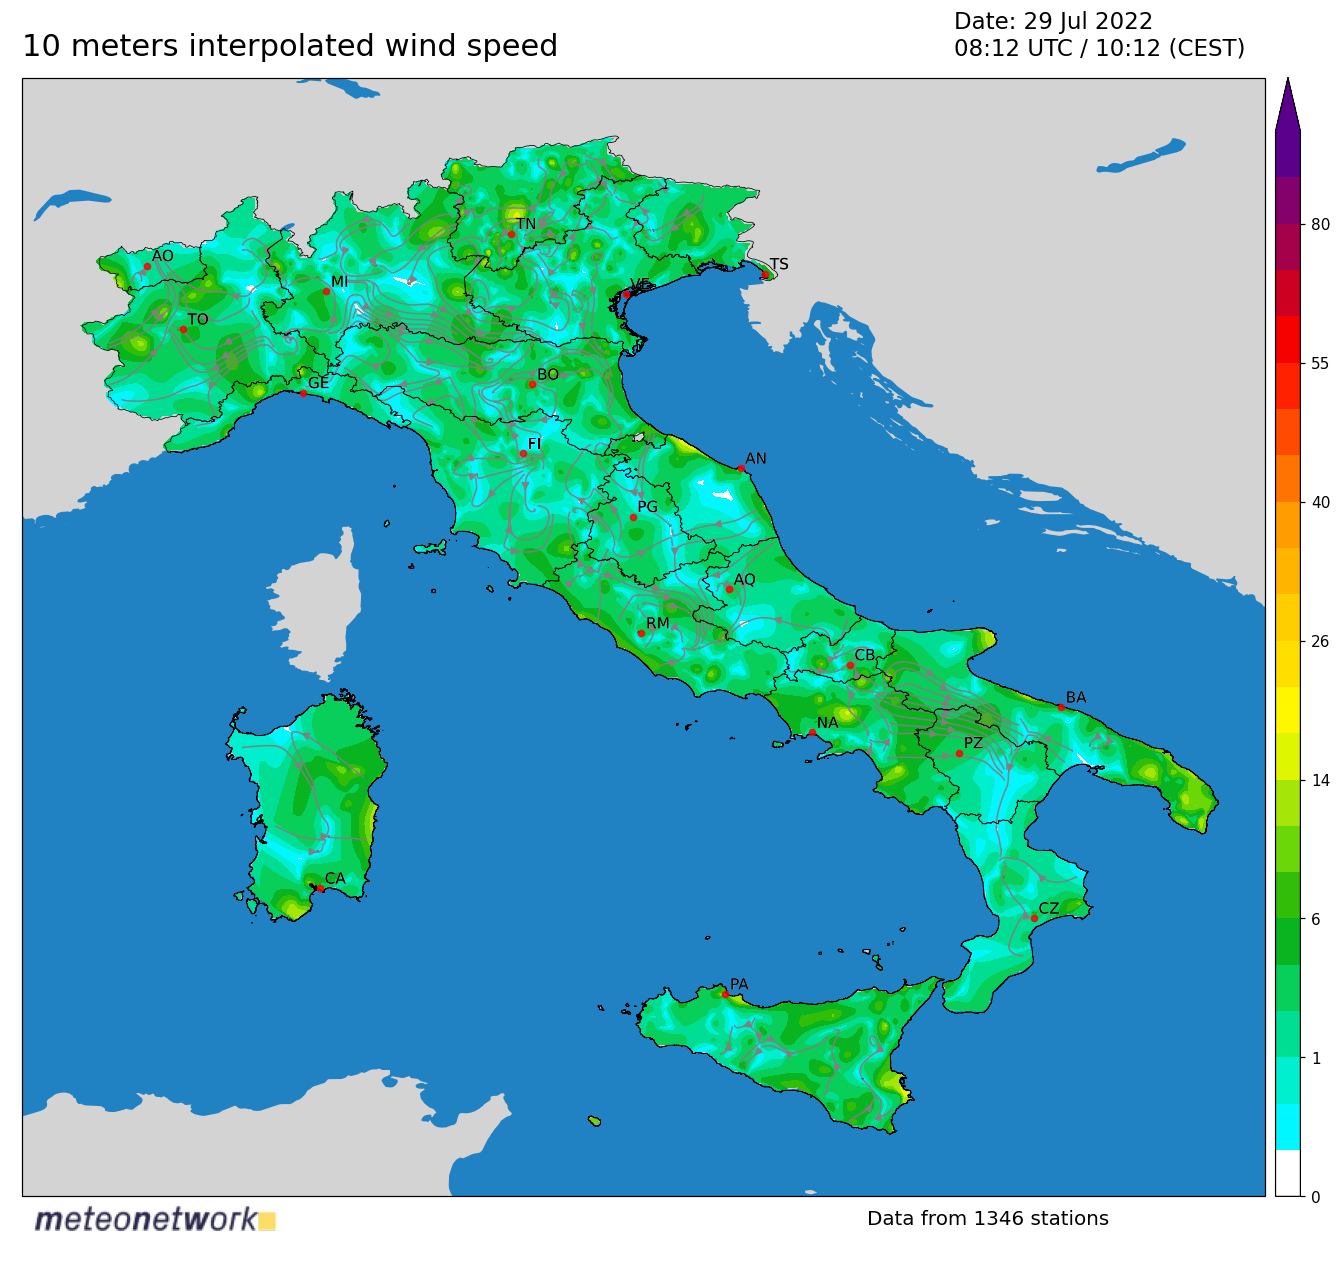
Note that I increased the density parameter to 5 and 10 but the final result is basically the same (only the computation time increases).
Do you have any hints to make the plotting faster and have more streamlines in the country plot?