Hello,
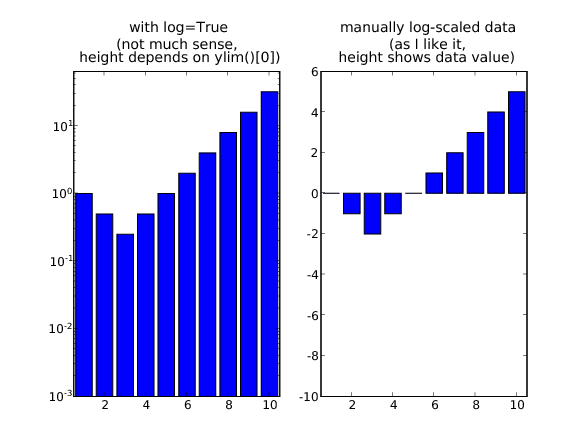
I noticed, that bar() with log=True plots very strange graphs. In fact,
the bars in this case grow from the bottom of the graph (I guess from
the value of log(+0), i.e. -∞). This way the relative height of the bars
says almost nothing about the value of data, because the bars are
higher, the lower is ylim()[0]. It is hard to distinguish data values
above and below 1 (positive and negative log).
I think that in many situations it is more useful to base bars on
the level of log(y)=0. This is achievable with manual log-scaling of
data, yet in this case it also requires manual tuning of ylabels.
I attach a script and an image which show the default plotting in
comparison to grow-from-log(1) plotting to see the difference, and
suggest making it possible to change the level from which the bars grow.
Best regards,
jetxee
logbar.py (474 Bytes)