I’m having a strange problem with my contour plots and I’m hoping someone here will be able to help. I had a dataset that was plotting fine until I decided I wanted to create plots with the data mirrored over the x-axis. This seems to work fine most of the time, but every now and then I get a plot that seems to just ignore a couple of data points when creating the contours. I’ve attached a plot of what I mean. Looking at the arrays the contour plot is created from doesn’t show any obvious problems (there are values there that should be plotted). It’s very strange, any ideas?
matplotlib 0.98.5.2
numpy 1.2.1
python 2.5.1
-Jeffrey
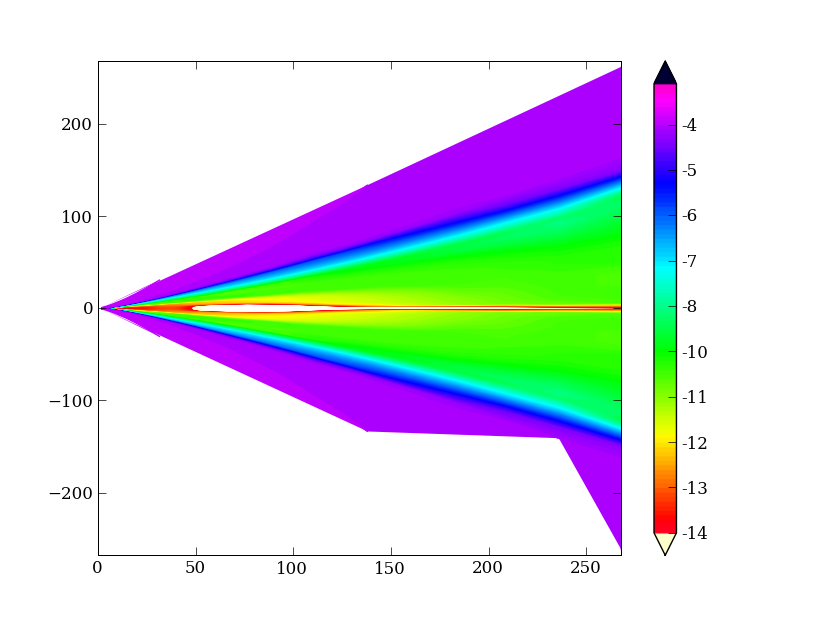
You might be running into one of the path simplification bugs in the 0.98.x series. Have you tried with the rcParam path.simplify turned off? If you can sent me a self contained script and data off-list, I can test this against the SVN version to see if this has already been addressed.
Cheers,
Mike
Jeffrey Fogel wrote:
···
I'm having a strange problem with my contour plots and I'm hoping someone here will be able to help. I had a dataset that was plotting fine until I decided I wanted to create plots with the data mirrored over the x-axis. This seems to work fine most of the time, but every now and then I get a plot that seems to just ignore a couple of data points when creating the contours. I've attached a plot of what I mean. Looking at the arrays the contour plot is created from doesn't show any obvious problems (there are values there that should be plotted). It's very strange, any ideas?
matplotlib 0.98.5.2
numpy 1.2.1
python 2.5.1
-Jeffrey
------------------------------------------------------------------------
------------------------------------------------------------------------
------------------------------------------------------------------------------
Enter the BlackBerry Developer Challenge This is your chance to win up to $100,000 in prizes! For a limited time, vendors submitting new applications to BlackBerry App World(TM) will have
the opportunity to enter the BlackBerry Developer Challenge. See full prize details at: http://p.sf.net/sfu/Challenge
------------------------------------------------------------------------
_______________________________________________
Matplotlib-users mailing list
Matplotlib-users@lists.sourceforge.net
matplotlib-users List Signup and Options
--
Michael Droettboom
Science Software Branch
Operations and Engineering Division
Space Telescope Science Institute
Operated by AURA for NASA