Hello.
I have run into a strange error where matplotlib compresses images
that are saved with the eps backend. Strangely, this compression seems
to happen only for images saved with certain figure sizes. I created a
very simple example which produces this behavior.
import pylab as P

import numpy as np

np.random.seed(0)

z=np.random.uniform(size=(22,22))


for figsize in [.5,.55]:

    F = P.figure(None,(figsize,figsize))

    ax = F.add_subplot(111)

    im = ax.imshow(z, origin="lower", interpolation="nearest")

    ax.xaxis.set_ticks([])

    ax.yaxis.set_ticks([])


    P.savefig('test_%.2f.eps' % figsize)
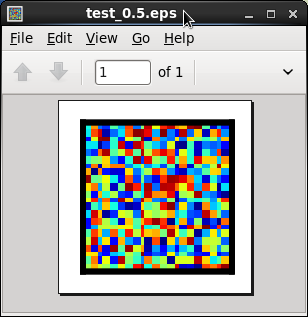
This code produces test_0.50.eps (attached) which shows ugly
compression whereas test_0.55.eps (also attached) is uncompressed.
Is there an easy way to disable this compression?
For reference, I am using python version 2.7.2, matplotlib version
1.1.0, and for clarity I do not have a matplotlibrc file.
Thanks for your help,
Joshua
test_0.50.eps (10.4 KB)
test_0.55.eps (12.6 KB)
Using Firefox, I see no difference between the two images. What are you using?
Ben Root
···
On Sun, Mar 18, 2012 at 5:07 PM, Joshua Lande <joshualande@…878…287…> wrote:
Hello.
I have run into a strange error where matplotlib compresses images
that are saved with the eps backend. Strangely, this compression seems
to happen only for images saved with certain figure sizes. I created a
very simple example which produces this behavior.
import pylab as P
import numpy as np
np.random.seed(0)
z=np.random.uniform(size=(22,22))
for figsize in [.5,.55]:
F = P.figure(None,(figsize,figsize))
ax = F.add_subplot(111)
im = ax.imshow(z, origin="lower", interpolation="nearest")
ax.xaxis.set_ticks([])
ax.yaxis.set_ticks([])
P.savefig('test_%.2f.eps' % figsize)
This code produces test_0.50.eps (attached) which shows ugly
compression whereas test_0.55.eps (also attached) is uncompressed.
Is there an easy way to disable this compression?
For reference, I am using python version 2.7.2, matplotlib version
1.1.0, and for clarity I do not have a matplotlibrc file.
Thanks for your help,
Joshua
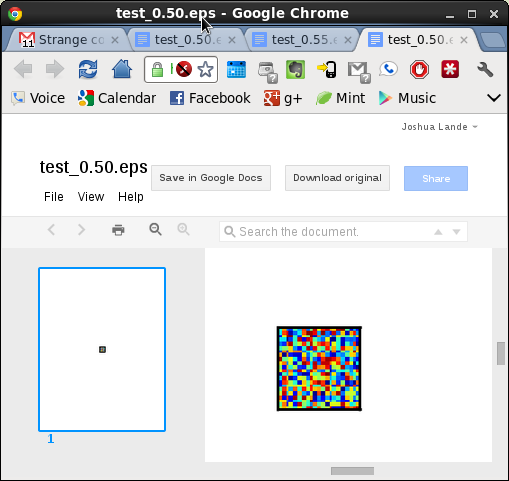
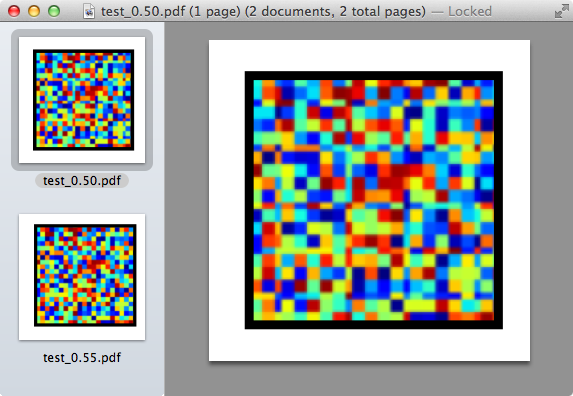
Hi. I have attached a screenshot of the way the image looks when
viewed by Preview on my mac, evince on my RHEL5 machine, and the built
in google docs image viewer.
The image should look like 22x22 square pixels, but (at least for me)
has stripes of strange looking rectangular pixels. The preview
screenshot shows both the good and bad version of the image.
I hope this makes sense.
Joshua
···
On Mon, Mar 19, 2012 at 10:59 AM, Benjamin Root <ben.root@...1304...> wrote:
On Sun, Mar 18, 2012 at 5:07 PM, Joshua Lande <joshualande@...287...> wrote:
Hello.
I have run into a strange error where matplotlib compresses images
that are saved with the eps backend. Strangely, this compression seems
to happen only for images saved with certain figure sizes. I created a
very simple example which produces this behavior.
import pylab as P
import numpy as np
np.random.seed(0)
z=np.random.uniform(size=(22,22))
for figsize in [.5,.55]:
F = P.figure(None,(figsize,figsize))
ax = F.add_subplot(111)
im = ax.imshow(z, origin="lower", interpolation="nearest")
ax.xaxis.set_ticks()
ax.yaxis.set_ticks()
P\.savefig\('test\_%\.2f\.eps' % figsize\)
This code produces test_0.50.eps (attached) which shows ugly
compression whereas test_0.55.eps (also attached) is uncompressed.
Is there an easy way to disable this compression?
For reference, I am using python version 2.7.2, matplotlib version
1.1.0, and for clarity I do not have a matplotlibrc file.
Thanks for your help,
Joshua
Using Firefox, I see no difference between the two images. What are you
using?
Ben Root
...
Using Firefox, I see no difference between the two images. What are you using?
Ben Root
All of the rows and columns are not the same width in the two images. Not limited to saving as eps. Also true if you change the example to png and then zoom in. Since imshow more than likely always saves as a raster, I'll bet the real problem is the number of pixels doesn't divide evenly into the size of z in Joshua's example.
Eric
···
From: Benjamin Root [mailto:ben.root@…1304…]
Sent: Monday, March 19, 2012 2:00 PM
To: Joshua Lande
Cc: matplotlib-users@lists.sourceforge.net
Subject: Re: [Matplotlib-users] Strange compression of matplotlib's eps figures
Ah, I see. Yeah, that’s not a bug, but a simple limitation of integer math. We have introduced a new option for interpolation in v1.1.0 that might help. Pass in the string “none” (not that python keyword) to the interpolation kwarg in imshow and maybe your results will look better.
Ben Root
···
On Mon, Mar 19, 2012 at 1:36 PM, Moore, Eric (NIH/NIDDK) [F] <eric.moore2@…3928…> wrote:
From: Benjamin Root [mailto:ben.root@…1304…]
Sent: Monday, March 19, 2012 2:00 PM
To: Joshua Lande
Cc: matplotlib-users@lists.sourceforge.net
Subject: Re: [Matplotlib-users] Strange compression of matplotlib’s eps figures
…
Using Firefox, I see no difference between the two images. What are you using?
Ben Root
All of the rows and columns are not the same width in the two images. Not limited to saving as eps. Also true if you change the example to png and then zoom in. Since imshow more than likely always saves as a raster, I’ll bet the real problem is the number of pixels doesn’t divide evenly into the size of z in Joshua’s example.
Eric
Setting interpolation="none" in imshow fixed the problem.
Thanks for the help,
Joshua
···
On Mon, Mar 19, 2012 at 11:34 AM, Joshua Lande <joshualande@...287...> wrote:
Hi. I have attached a screenshot of the way the image looks when
viewed by Preview on my mac, evince on my RHEL5 machine, and the built
in google docs image viewer.
The image should look like 22x22 square pixels, but (at least for me)
has stripes of strange looking rectangular pixels. The preview
screenshot shows both the good and bad version of the image.
I hope this makes sense.
Joshua
On Mon, Mar 19, 2012 at 10:59 AM, Benjamin Root <ben.root@...1304...> wrote:
On Sun, Mar 18, 2012 at 5:07 PM, Joshua Lande <joshualande@...287...> wrote:
Hello.
I have run into a strange error where matplotlib compresses images
that are saved with the eps backend. Strangely, this compression seems
to happen only for images saved with certain figure sizes. I created a
very simple example which produces this behavior.
import pylab as P
import numpy as np
np.random.seed(0)
z=np.random.uniform(size=(22,22))
for figsize in [.5,.55]:
F = P.figure(None,(figsize,figsize))
ax = F.add_subplot(111)
im = ax.imshow(z, origin="lower", interpolation="nearest")
ax.xaxis.set_ticks()
ax.yaxis.set_ticks()
P\.savefig\('test\_%\.2f\.eps' % figsize\)
This code produces test_0.50.eps (attached) which shows ugly
compression whereas test_0.55.eps (also attached) is uncompressed.
Is there an easy way to disable this compression?
For reference, I am using python version 2.7.2, matplotlib version
1.1.0, and for clarity I do not have a matplotlibrc file.
Thanks for your help,
Joshua
Using Firefox, I see no difference between the two images. What are you
using?
Ben Root