Hi folks, I’m observing some strange behaviour when using plt.contourf to plot contours. In the first instance everything seems fine. But when I plot again the contours are barely visible.
(e.g.)
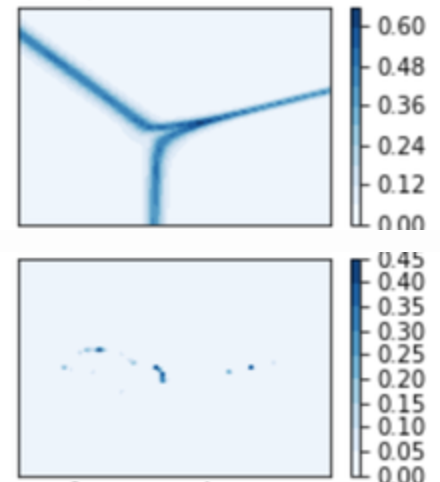
Each plot corresponds to the same underlying model for which the contours are derived, but different way of initialising its params. The only thing that jumps immediately is that the second plot has max values around 0.45 while the first 0.60, from the colorbar. Could that be the issue here though?
MWE:
def plot_contour(points, z, title, levels=14, ax=None, fig=None):
    N = np.int_(np.sqrt(points.shape[0]))
    z = z.reshape((N, N))
    x = np.linspace(np.min(points[:, 0]), np.max(points[:, 0]), N)
    y = np.linspace(np.min(points[:, 1]), np.max(points[:, 1]), N)

    if ax is None or fig is None:
        plt.figure()
        cs = plt.contourf(x, y, z, levels=levels, cmap='Blues')
        cbar = plt.colorbar(cs)
        plt.suptitle(title)
    else:
        cs = ax.contourf(x, y, z, levels=levels, cmap='Blues')
        cbar = fig.colorbar(cs, ax=ax)
        ax.set_title(title)