Hello everybody,
I am experiencing a strange behavior with the scatter() function when
using different figure canvas y dimensions in inches.
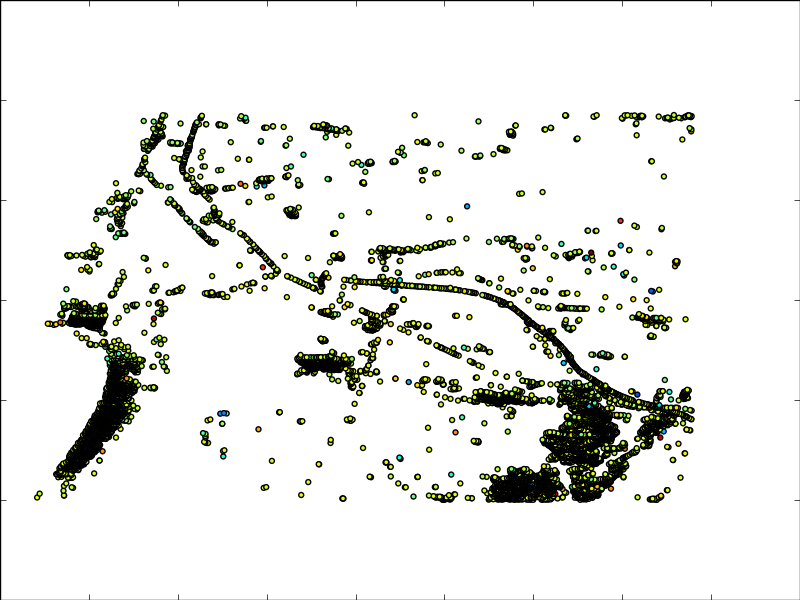
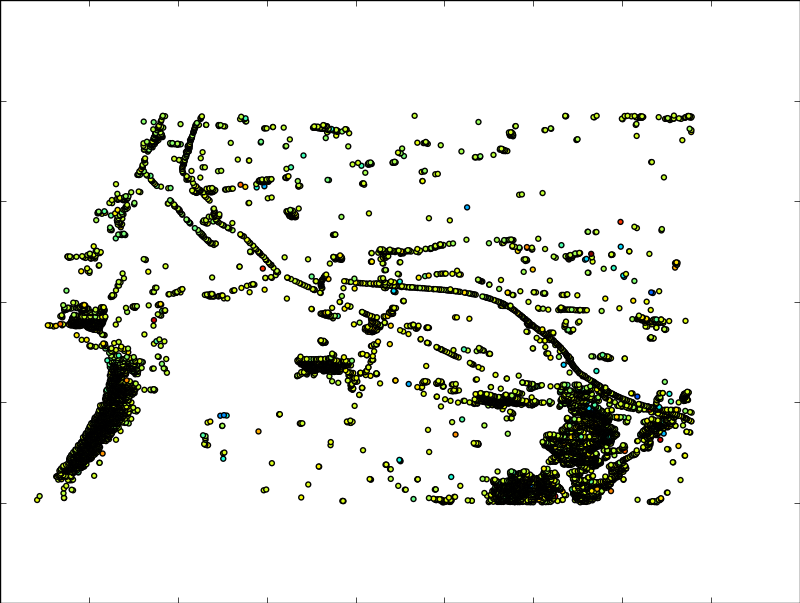
Executing the code listed below, I obtain good images when using some dimensions
and totally white images when using others.
I have attached the input data buffers and the resulting images too.
#!/usr/bin/python
import numpy as n
import pylab as p
def scatterFun(x, y, data, yCanvasDimInches, imageName):
""" This function draws a scatterogram for the input data. """
canvasObj = p.figure(figsize=(8, yCanvasDimInches), dpi=100)
axisObj = canvasObj.add_axes([0, 0, 1, 1])
axisObj.scatter(x, y, 10, data, 'o')

canvasObj.savefig(imageName, dpi=100)
p.close()
data buffer files
yPosFile = “/users/lelepass/python/test_scatter/yPos”
xPosFile = “/users/lelepass/python/test_scatter/xPos”
dataFile = “/users/lelepass/python/test_scatter/data”
loading data
s = file(dataFile, ‘rb’).read()
data = n.fromstring(s, ‘f’)
s = file(yPosFile, ‘rb’).read()
y = n.fromstring(s, ‘d’)
s = file(xPosFile, ‘rb’).read()
x = n.fromstring(s, ‘d’)
scatterogram generation
scatterFun(x, y, data, 6, “pippo1.png”)
scatterFun(x, y, data, 6.01, “pippo2.png”)
scatterFun(x, y, data, 6.015, “pippo3.png”)
scatterFun(x, y, data, 6.02, “pippo4.png”)
scatterFun(x, y, data, 6.028, “pippo5.png”)
scatterFun(x, y, data, 6.03, “pippo6.png”)
Can anyone help me ?
I use
Linux openSUSE 11.3 (x86_64)
Linux sat1 2.6.34.7-0.7-default #1 SMP 2010-12-13 11:13:53 +0100 x86_64 x86_64 x86_64 GNU/Linux
Python 2.6.5
numpy 1.5.1
matplotlib 1.0.1 with backend Agg v2.2
On the same system descripted above linking matplotlib from svn
matplotlib-matplotlib-v1.0.1-756-g3c43d83.tar.gz instead of the installed one,
all the images are white.
If it can be of some help this strange behavior does not appear with a system
Linux Ubuntu 9.10
Linux joshua 2.6.28-11-server #42-Ubuntu SMP Fri Apr 17 02:48:10 UTC 2009 i686 GNU/Linux
Python 2.6.4
numpy 1.3.0
matplotlib 0.99.0 with backend Agg v2.2
Executing the script with verbosity I get the subsequent output
$HOME=/users/lelepass
CONFIGDIR=/users/lelepass/.matplotlib
Bad key “numerix” on line 30 in
/users/lelepass/.matplotlib/matplotlibrc.
You probably need to get an updated matplotlibrc file from
http://matplotlib.sf.net/_static/matplotlibrc or from the matplotlib source
distribution
matplotlib data path /usr/lib64/python2.6/site-packages/matplotlib/mpl-data
loaded rc file /users/lelepass/.matplotlib/matplotlibrc
matplotlib version 1.0.1
verbose.level helpful
interactive is False
units is True
platform is linux2
Using fontManager instance from /users/lelepass/.matplotlib/fontList.cache
backend agg version v2.2
findfont: Matching :family=sans-serif:style=normal:variant=normal:weight=normal:stretch=normal:size=medium to Bitstream Vera Sans (/usr/lib64/python2.6/site-packages/matplotlib/mpl-data/fonts/ttf/Vera.ttf) with score of 0.000000
Thank you all.
Bye.
Emanuele Passera
Software Engineer
Tele-Rilevamento Europa - T.R.E. srl
Via Vittoria Colonna, 7
20149 Milano – Italia
Tel.: +39.02.4343.121 - Fax: +39.02.4343.1230
emanuele.passera@…1676… - www.treuropa.com
data (34.6 KB)
xPos (69.1 KB)
yPos (69.1 KB)


···
–
This communication, that may contain confidential and/or legally privileged information, is intended solely for the use of the intended addressees. Opinions, conclusions and other information contained in this message, that do not relate to the official business of this firm, shall be considered as not given or endorsed by it. Every opinion or advice contained in this communication is subject to the terms and conditions provided by the agreement governing the engagement with such a client. If you have received this communication in error, please notify us immediately by responding to this email and then delete it from your system. Any use, disclosure, copying or distribution of the contents of this communication by a not-intended recipient or in violation of the purposes of this communication is strictly prohibited and may be unlawful.
–