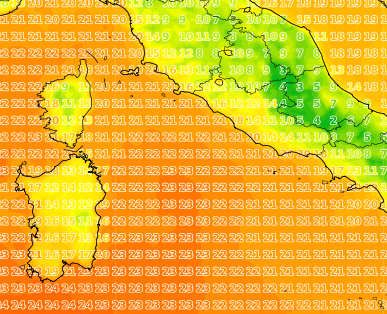
I need to produce a map which shows, as overlay, the variable values in some grid point.
Here is an example
In order to do that I’m annotating the plot manually by doing a loop on a reduced array
var = var[::5, ::5] # a xarray.DataArray, subsetted every 5 points

lons = var.lon.values
lats = var.lat.values

for ilat, ilon in np.ndindex(var.shape):
      ax.annotate(
                ('%d' % var[ilat, ilon]),
                (lons[ilon], lats[ilat]),
                zorder=5)
This takes about 1.5 seconds, which is not too long if you think about it, but becomes way too long when you think that I have to do the same plot for many time steps and different geographic projections. Even when using parallel workers I have to wait 2 minutes for the script to complete.
Is there any way to make the plotting faster? Any way to avoid the loop to do multiple annotations?
It would be good if matplotlib had a builtin way of doing similar maps, because the way I’m doing it still remains quite hacky, especially since you have to tune the integer in the slicing of var to have text that do not overlap on the map. I believe there should be a way to do this in a better and automated way.