When I specify an ecolor parameter in an errorbar plot, the resulting graph doesn’t cycle through the differ colors in the plotted lines. See code below for example.
%matplotlib notebook
import matplotlib.pyplot as plt
# example data
x = np.arange(0.1, 4, 0.5)
y = np.exp(-x)
fig, (ax0, ax1) = plt.subplots(nrows=2, sharex=True)
for n in range(4):
y = np.exp(x+n)
my_error = y*0.25
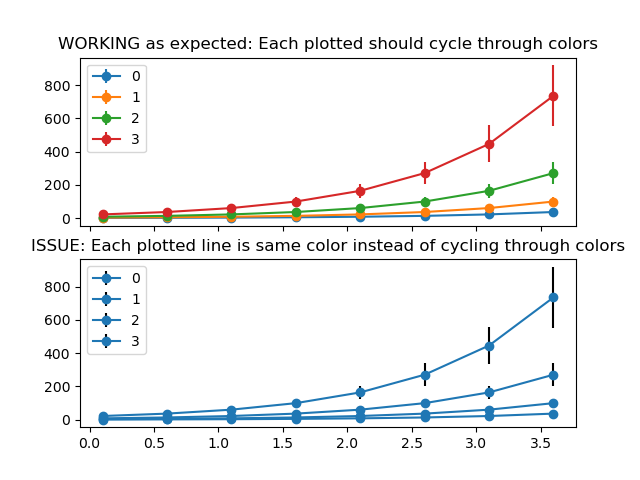
ax0.errorbar(x, y, yerr=my_error, linestyle='-', marker='o', label=n, ) # Wihtout specifying ecolor
ax1.errorbar(x, y, yerr=my_error, linestyle='-', marker='o', label=n, ecolor='black' ) # WIth specifying ecolor
ax0.set_title('WORKING as expected: Each plotted should cycle through colors')
ax1.set_title('ISSUE: Each plotted line is same color instead of cycling through colors')
ax0.legend()
ax1.legend()
plt.show()
