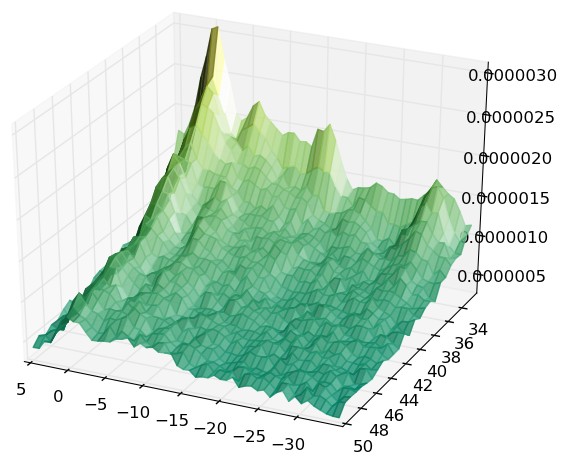
I’m trying to make a surface plot using the latest version of mplot3d
from the git trunk and I have a couple of questions. The attached
image is close to what I would like. The associated plot command I am
using is
ax.plot_surface(X, Y, Z, rstride=1, cstride=1, alpha=0.8, shade=True,
cmap=plt.cm.summer,

color='k',

facecolors='k',

lightsource = LightSource(azdeg=0, altdeg=0),

)
- Is there support now to automatically annotate the axis so that a
multiplier is added, as occurs in 2D plots, or should I do this
manually by rescaling the data for the moment?
Yes, offset text is now automatic and should activate in similar manner as it does for regular 2D axis formatters. You were one order of magnitude off from automatically triggering it. Also, I should note that it might be better to use “ax = fig.gca(projection=‘3d’)” instead of “ax = Axes3D(fig)” because the former will leave more of a margin, which would allow the offset text to be fully visible. If you want the full figure area, then you may need to fiddle with the ax.zaxis._axinfo[‘label’][‘space_factor’] to bring it and the axis label closer to the axis.
The odd thing that I am encountering right now while investigating your problem is that I can’t seem to force the use of the offset. It could just be that I am doing it wrong, but I will look closer.
- Currently, it doesn’t appear possible to shade the surface patches
according to just a base facecolor and their orientation to a light
source. Do I have to define a new colormap with a constant/single
colour to achieve this?
Looking over the plot_surface code, this appears to be the case, however, looking back over the LightSource code, I believe it might be possible to update plot_surface to operate on situations where no cmap is specified. I will take a look today at that possibility and see if I can get it out for the v1.1.0 release.
- I have set alpha=0.8 to allow the wireframe lines to show through a
little. When shade=False, the wireframe is visible but I lose
orientation-based shading. Is there a way to overlay the wireframe
properly when shade=True?
In plot_surface, when shade=True, it appears that both the facecolors and the edgecolors are set to the same colors. The only reason why the lines show up when you set transparency is that that alpha value is applied only to the faces and not the edges. Specifically, the logic is as follows:
if fcolors is specified, then set that color for both facecolor and edgecolor.
Else, if a cmap is specified, then give the polygon collection the data, limits and norm it needs to determine color itself.
Else, then use the value of “color” to specify only the facecolors.
I think the first branch of this logic is a bit wonky. I am inclined to make a small change that would only set the edgecolors if ‘edgecolors’ was not provided as a kwarg. This would enable users to specify the edgecolor they want without worrying about something else over-riding it. The only problem seems to be that there would be no shading of these grid lines. Would that still be acceptable to you?
Thanks for your valuable feedback!
Ben Root
···
On Thu, Jul 21, 2011 at 1:10 AM, gary ruben <gary.ruben@…287…> wrote: