Disclaimer: I do know Python, but am not terribly familiar with Matplotlib as
I'm taking over the maintenance of our graphing libraries. This post is
likely to leave out details that you need to help diagnose the problem, but I
didn't think posting all 1500 or so lines of our graphing routines would be
that helpful at this point. 
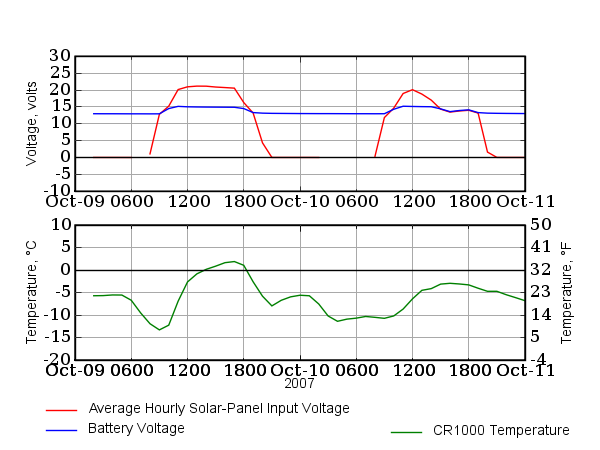
As you can see from the attached graph, there is a break the in graph
somewhere around 7 AM or so. This is the data I am graphing for that red
line:
"2007-10-09 00:00:00",0.015
"2007-10-09 01:00:00",0.015
"2007-10-09 02:00:00",0.014
"2007-10-09 03:00:00",0.012
"2007-10-09 04:00:00",0.008
"2007-10-09 05:00:00",0.002
"2007-10-09 06:00:00",-0.006
"2007-10-09 07:00:00",1.068
"2007-10-09 08:00:00",12.8
"2007-10-09 09:00:00",15.21
"2007-10-09 10:00:00",20.13
"2007-10-09 11:00:00",20.94
"2007-10-09 12:00:00",21.15
"2007-10-09 13:00:00",21.13
"2007-10-09 14:00:00",20.88
"2007-10-09 15:00:00",20.72
"2007-10-09 16:00:00",20.55
"2007-10-09 17:00:00",16.28
"2007-10-09 18:00:00",13.18
"2007-10-09 19:00:00",4.342
"2007-10-09 20:00:00",0.016
"2007-10-09 21:00:00",0.015
"2007-10-09 22:00:00",0.015
"2007-10-09 23:00:00",0.015
If I change the -0.006 at 6:00AM to 0.006, it graphs with no break in the
line. This is not a big deal to me, but it is a big deal to the consumer of
these graphs. Could this be a bug in matplotlib, or is it more likely a bug
in what we're doing with the data (almost nothing) before it gets to the
matplotlib graphing routines?
Thanks for any insight you can give.
j
···
--
Joshua Kugler
Lead System Admin -- Senior Programmer
http://www.eeinternet.com
PGP Key: http://pgp.mit.edu/ ID 0xDB26D7CE
PO Box 80086 -- Fairbanks, AK 99708 -- Ph: 907-456-5581 Fax: 907-456-3111