I know matplotlib mimics matlab, which offers scientific look.
but can we use matplotlib to get a skecth(in other words,
hand-drawing) style for bar/pie/etc in none formalist paper? for
example, http://teethgrinder.co.uk/open-flash-chart/gallery-bar-7.php
thanks
With a considerable effort you could use mpl's capabilities to program this sort of thing, but it will not be added as an option.
Eric
···
On 05/06/2010 08:02 PM, oyster wrote:
I know matplotlib mimics matlab, which offers scientific look.
but can we use matplotlib to get a skecth(in other words,
hand-drawing) style for bar/pie/etc in none formalist paper? for
example, Teeth Grinder UK – Super Powered Tech and Programming Blog
thanks
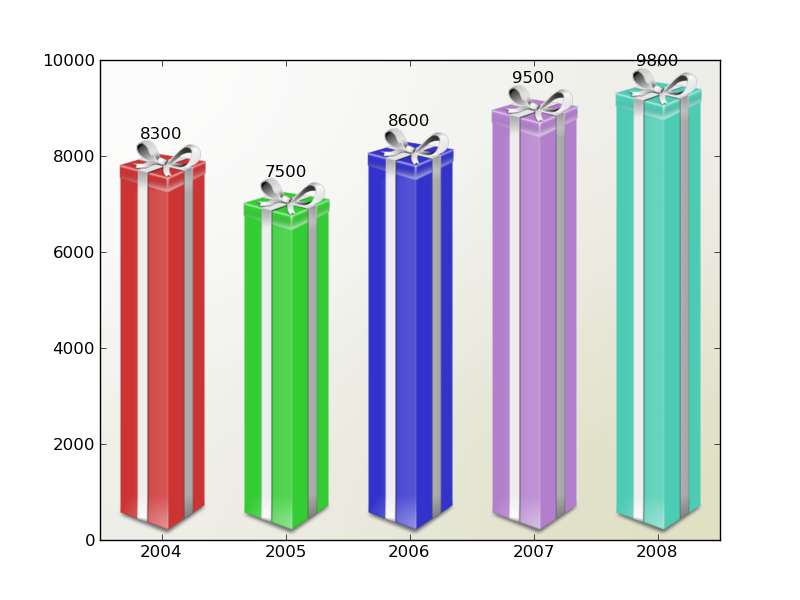
JJ's demo_ribbon_box is pretty close -- you just need to create a base
image you want stretched to the bar height.
import matplotlib.pyplot as plt
import numpy as np
from matplotlib.image import BboxImage
from matplotlib._png import read_png
import matplotlib.colors
from matplotlib.cbook import get_sample_data
class RibbonBox(object):
original_image = read_png(get_sample_data("Minduka_Present_Blue_Pack.png",
asfileobj=False))
cut_location = 70
b_and_h = original_image[:,:,2]
color = original_image[:,:,2] - original_image[:,:,0]
alpha = original_image[:,:,3]
nx = original_image.shape[1]
def __init__(self, color):
rgb = matplotlib.colors.colorConverter.to_rgb(color)
im = np.empty(self.original_image.shape,
self.original_image.dtype)
im[:,:,:3] = self.b_and_h[:,:,np.newaxis]
im[:,:,:3] -= self.color[:,:,np.newaxis]*(1.-np.array(rgb))
im[:,:,3] = self.alpha
self.im = im
def get_stretched_image(self, stretch_factor):
stretch_factor = max(stretch_factor, 1)
ny, nx, nch = self.im.shape
ny2 = int(ny*stretch_factor)
stretched_image = np.empty((ny2, nx, nch),
self.im.dtype)
cut = self.im[self.cut_location,:,:]
stretched_image[:,:,:] = cut
stretched_image[:self.cut_location,:,:] = \
self.im[:self.cut_location,:,:]
stretched_image[-(ny-self.cut_location):,:,:] = \
self.im[-(ny-self.cut_location):,:,:]
self._cached_im = stretched_image
return stretched_image
class RibbonBoxImage(BboxImage):
zorder = 1
def __init__(self, bbox, color,
cmap = None,
norm = None,
interpolation=None,
origin=None,
filternorm=1,
filterrad=4.0,
resample = False,
**kwargs
):
BboxImage.__init__(self, bbox,
cmap = cmap,
norm = norm,
interpolation=interpolation,
origin=origin,
filternorm=filternorm,
filterrad=filterrad,
resample = resample,
**kwargs
)
self._ribbonbox = RibbonBox(color)
self._cached_ny = None
def draw(self, renderer, *args, **kwargs):
bbox = self.get_window_extent(renderer)
stretch_factor = bbox.height / bbox.width
ny = int(stretch_factor*self._ribbonbox.nx)
if self._cached_ny != ny:
arr = self._ribbonbox.get_stretched_image(stretch_factor)
self.set_array(arr)
self._cached_ny = ny
BboxImage.draw(self, renderer, *args, **kwargs)
if 1:
from matplotlib.transforms import Bbox, TransformedBbox
from matplotlib.ticker import ScalarFormatter
fig = plt.gcf()
fig.clf()
ax = plt.subplot(111)
years = np.arange(2004, 2009)
box_colors = [(0.8, 0.2, 0.2),
(0.2, 0.8, 0.2),
(0.2, 0.2, 0.8),
(0.7, 0.5, 0.8),
(0.3, 0.8, 0.7),
]
heights = np.random.random(years.shape) * 7000 + 3000
fmt = ScalarFormatter(useOffset=False)
ax.xaxis.set_major_formatter(fmt)
for year, h, bc in zip(years, heights, box_colors):
bbox0 = Bbox.from_extents(year-0.4, 0., year+0.4, h)
bbox = TransformedBbox(bbox0, ax.transData)
rb_patch = RibbonBoxImage(bbox, bc, interpolation="bicubic")
ax.add_artist(rb_patch)
ax.annotate(r"%d" % (int(h/100.)*100),
(year, h), va="bottom", ha="center")
patch_gradient = BboxImage(ax.bbox,
interpolation="bicubic",
zorder=0.1,
)
gradient = np.zeros((2, 2, 4), dtype=np.float)
gradient[:,:,:3] = [1, 1, 0.]
gradient[:,:,3] = [[0.1, 0.3],[0.3, 0.5]] # alpha channel
patch_gradient.set_array(gradient)
ax.add_artist(patch_gradient)
ax.set_xlim(years[0]-0.5, years[-1]+0.5)
ax.set_ylim(0, 10000)
fig.savefig('ribbon_box.png')
plt.show()
demo_ribbon_box.py (4.19 KB)
···
On Fri, May 7, 2010 at 1:09 PM, Eric Firing <efiring@...202...> wrote:
On 05/06/2010 08:02 PM, oyster wrote:
I know matplotlib mimics matlab, which offers scientific look.
but can we use matplotlib to get a skecth(in other words,
hand-drawing) style for bar/pie/etc in none formalist paper? for
example, Teeth Grinder UK – Super Powered Tech and Programming Blog
thanksWith a considerable effort you could use mpl's capabilities to program
this sort of thing, but it will not be added as an option.
You may also try saving as SVG and then loading in Inkscape and using its various "artistic" vector plugins to achieve similar results.
Mike
John Hunter wrote:
···
On Fri, May 7, 2010 at 1:09 PM, Eric Firing <efiring@...202...> wrote:
On 05/06/2010 08:02 PM, oyster wrote:
I know matplotlib mimics matlab, which offers scientific look.
but can we use matplotlib to get a skecth(in other words,
hand-drawing) style for bar/pie/etc in none formalist paper? for
example, Teeth Grinder UK – Super Powered Tech and Programming Blog
thanks
With a considerable effort you could use mpl's capabilities to program
this sort of thing, but it will not be added as an option.
JJ's demo_ribbon_box is pretty close -- you just need to create a base
image you want stretched to the bar height.import matplotlib.pyplot as plt
import numpy as np
from matplotlib.image import BboxImagefrom matplotlib._png import read_png
import matplotlib.colors
from matplotlib.cbook import get_sample_dataclass RibbonBox(object):
original_image = read_png(get_sample_data("Minduka_Present_Blue_Pack.png",
asfileobj=False))
cut_location = 70
b_and_h = original_image[:,:,2]
color = original_image[:,:,2] - original_image[:,:,0]
alpha = original_image[:,:,3]
nx = original_image.shape[1]def __init__(self, color):
rgb = matplotlib.colors.colorConverter.to_rgb(color)im = np.empty(self.original_image.shape,
self.original_image.dtype)im[:,:,:3] = self.b_and_h[:,:,np.newaxis]
im[:,:,:3] -= self.color[:,:,np.newaxis]*(1.-np.array(rgb))
im[:,:,3] = self.alphaself.im = im
def get_stretched_image(self, stretch_factor):
stretch_factor = max(stretch_factor, 1)
ny, nx, nch = self.im.shape
ny2 = int(ny*stretch_factor)stretched_image = np.empty((ny2, nx, nch),
self.im.dtype)
cut = self.im[self.cut_location,:,:]
stretched_image[:,:,:] = cut
stretched_image[:self.cut_location,:,:] = \
self.im[:self.cut_location,:,:]
stretched_image[-(ny-self.cut_location):,:,:] = \
self.im[-(ny-self.cut_location):,:,:]self._cached_im = stretched_image
return stretched_imageclass RibbonBoxImage(BboxImage):
zorder = 1def __init__(self, bbox, color,
cmap = None,
norm = None,
interpolation=None,
origin=None,
filternorm=1,
filterrad=4.0,
resample = False,
**kwargs
):BboxImage.__init__(self, bbox,
cmap = cmap,
norm = norm,
interpolation=interpolation,
origin=origin,
filternorm=filternorm,
filterrad=filterrad,
resample = resample,
**kwargs
)self._ribbonbox = RibbonBox(color)
self._cached_ny = Nonedef draw(self, renderer, *args, **kwargs):
bbox = self.get_window_extent(renderer)
stretch_factor = bbox.height / bbox.widthny = int(stretch_factor*self._ribbonbox.nx)
if self._cached_ny != ny:
arr = self._ribbonbox.get_stretched_image(stretch_factor)
self.set_array(arr)
self._cached_ny = nyBboxImage.draw(self, renderer, *args, **kwargs)
if 1:
from matplotlib.transforms import Bbox, TransformedBbox
from matplotlib.ticker import ScalarFormatterfig = plt.gcf()
fig.clf()
ax = plt.subplot(111)years = np.arange(2004, 2009)
box_colors = [(0.8, 0.2, 0.2),
(0.2, 0.8, 0.2),
(0.2, 0.2, 0.8),
(0.7, 0.5, 0.8),
(0.3, 0.8, 0.7),
]
heights = np.random.random(years.shape) * 7000 + 3000fmt = ScalarFormatter(useOffset=False)
ax.xaxis.set_major_formatter(fmt)for year, h, bc in zip(years, heights, box_colors):
bbox0 = Bbox.from_extents(year-0.4, 0., year+0.4, h)
bbox = TransformedBbox(bbox0, ax.transData)
rb_patch = RibbonBoxImage(bbox, bc, interpolation="bicubic")ax.add_artist(rb_patch)
ax.annotate(r"%d" % (int(h/100.)*100),
(year, h), va="bottom", ha="center")patch_gradient = BboxImage(ax.bbox,
interpolation="bicubic",
zorder=0.1,
)
gradient = np.zeros((2, 2, 4), dtype=np.float)
gradient[:,:,:3] = [1, 1, 0.]
gradient[:,:,3] = [[0.1, 0.3],[0.3, 0.5]] # alpha channel
patch_gradient.set_array(gradient)
ax.add_artist(patch_gradient)ax.set_xlim(years[0]-0.5, years[-1]+0.5)
ax.set_ylim(0, 10000)fig.savefig('ribbon_box.png')
plt.show()------------------------------------------------------------------------
------------------------------------------------------------------------
------------------------------------------------------------------------------
------------------------------------------------------------------------_______________________________________________
Matplotlib-users mailing list
Matplotlib-users@lists.sourceforge.net
matplotlib-users List Signup and Options
--
Michael Droettboom
Science Software Branch
Operations and Engineering Division
Space Telescope Science Institute
Operated by AURA for NASA