I have non-RGB data and I want to simulate how the colormap looks using it. colorspacious seems to only work on RGB data, so I was thinking of applying it to the cmap and then using the converted cmap, but the mpl cmaps are all linearsegemented colormaps and I don’t know how to get that into the format colorspacious expects (RGB matrix). What should I actually be doing? VISCM doesn’t seem right because I need to get the plots back to plot them underneath and it’s just applying the colorblindness check to the cmap swatch and not to the underlying data. My instinct right now is to reverse engineer the LinearSegmentedColormap.from_list code but checking if I’ve just gone too deep down a rabbit hole.
1 Like
Can you provide some sort of example? I’m having trouble telling how you are translating “non-RGB” data into color without a colormap.
Thanks @jklymak, you’re right that an example would definitely be clearer. I have a swatch of temperature data and am applying different colormaps to it:
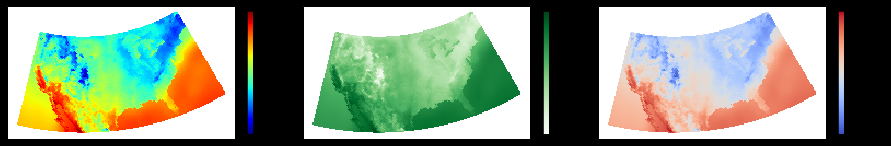
What I want to simulate what these images would look like to someone who is colorblind. And preferably in a way where I can plot those images, which viscm doesn’t seem to cleanly allow (it looked script based/it pops up it’s dashboard) and colorspacious needs an RGB image.
And now I’m realizing I can totally get which color each pixel in the dataset is mapped to via cmap(norm(d)) for d in data.ravel(), run that through colorspacious, and then reshape that back into the array and plot that. Unless there’s a more sensible approach?
I’d just run each color in the colormap through colorspacious and make a new colormap. i.e. jet_colorblind=colorspacious(jet). Also don’t use a LinearSegmentedColormap, just use a ListedColormap. See https://matplotlib.org/3.1.1/tutorials/colors/colormap-manipulation.html
Hey, I used this little script to simulate colorblindness for moderate and full deuteranomaly (most common form of red/green colorblindness):
from skimage.io import imread, imsave
from skimage import img_as_ubyte, img_as_float
from colorspacious import cspace_convert
import numpy as np

img = img_as_float(imread('images/feuerwerk.jpg'))

for severity in [50, 100]:
    cvd_space = {
        "name": "sRGB1+CVD",
        "cvd_type": "deuteranomaly",
        "severity": severity,
    }

    img_deuter = cspace_convert(img, cvd_space, 'sRGB1')
    img_deuter = img_as_ubyte(np.clip(img_deuter, 0, 1))
    imsave(f'build/plots/fireworks_deuter_{severity}.jpg', img_deuter)