Hi, I want to plot a multi-channel signal’s PSD.
I hope the figure will show the name of the channel where my mouse clicked.
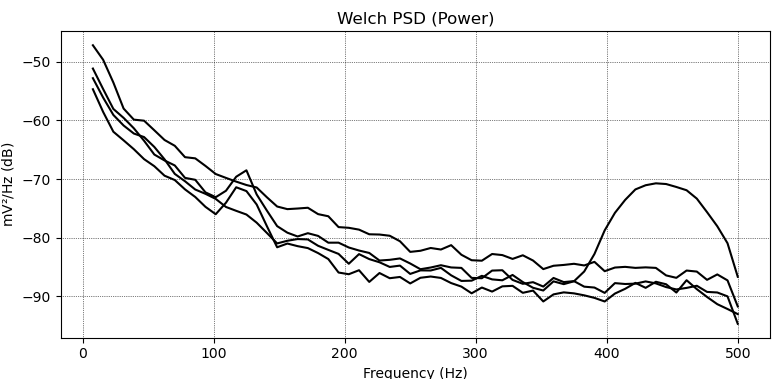
Here is a screenshot of the figure.
Anyone knows how to do this using
fig.canvas.mpl_connect('button_press_event', funcs)
To be specific, how do I write my funcs?