Hi,
I narrowed down the problem I've posted on the matplotlib user list
and now it looks like I found a matplotlib bug in 0.98 version.
The shared axes auto-scaling is not properly working in 0.98 (works
with the 0.91). Indeed, As shown, in the small attached script, the
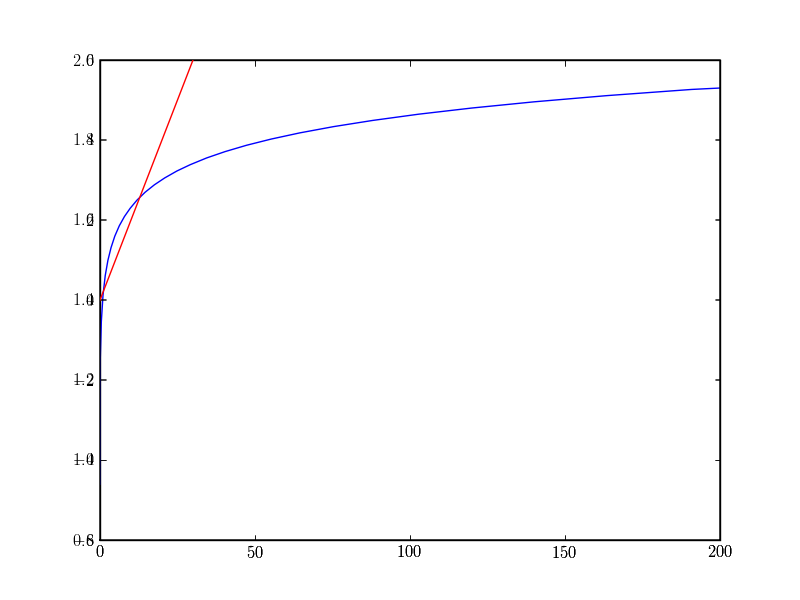
shared x scale does not show the full curves (axs1 blue curve should go up to 120 on axis).
In fact, if x axes is shared, the figure xmin and xmax are defined by the last plotted axes (axs2) and does not take into account the min/max from the first one which cut it. One would expect to see both curve entirely.
Could someone have look at this problem. I will try to dive in matplotlib code but I'm not an expert at all...
Thanks in advance,
David
shared_axes_problem.py (359 Bytes)
David Trem wrote:
Hi,
I narrowed down the problem I've posted on the matplotlib user list
and now it looks like I found a matplotlib bug in 0.98 version.
The shared axes auto-scaling is not properly working in 0.98 (works
with the 0.91). Indeed, As shown, in the small attached script, the
shared x scale does not show the full curves (axs1 blue curve should go up to 120 on axis).
In fact, if x axes is shared, the figure xmin and xmax are defined by the last plotted axes (axs2) and does not take into account the min/max from the first one which cut it. One would expect to see both curve entirely.
Could someone have look at this problem. I will try to dive in matplotlib code but I'm not an expert at all...
David,
This looks like a rather fundamental problem in the present architecture. I thought I had a solution figured out, but I was wrong, and now I am not confident that I can come up with a good solution quickly. Some consultation with, or intervention by, Mike D. may be needed--he might even see a solution in a matter of minutes. The problem is that the dataLim for each axes object is a Bbox, and in this implementation there is no way to share an x-interval or a y-interval among Bboxes. So there is a single xaxis major locator that is shared, but it is only getting its dataLim updated from one of the shared axes.
Eric
···
Thanks in advance,
David
David,
There is no code in matplotlib to autoscale shared axes, and as far as I know, there never has been. Unfortunately, it's more or less a requirement that you have to set the limits manually when using shared axes. (All of the shared axes examples do this).
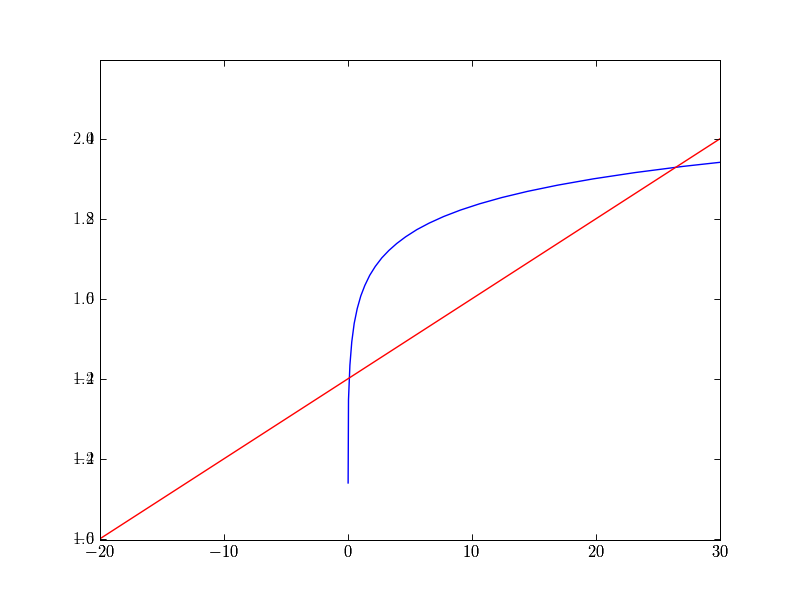
I think, 0.91 is broken also, it just happens to use the first plotted line rather than the second (it truncates the red line, rather than the blue one). The difference in ordering is due to the fact that sharing is now always bi-directional in 0.98 and it uses dictionaries with a somewhat random ordering, rather than lists. If you see different behavior than my plots (attached) let me know.
Eric Firing wrote:
This looks like a rather fundamental problem in the present architecture. I thought I had a solution figured out, but I was wrong, and now I am not confident that I can come up with a good solution quickly. Some consultation with, or intervention by, Mike D. may be needed--he might even see a solution in a matter of minutes. The problem is that the dataLim for each axes object is a Bbox, and in this implementation there is no way to share an x-interval or a y-interval among Bboxes. So there is a single xaxis major locator that is shared, but it is only getting its dataLim updated from one of the shared axes.
Just to clarify: this limitation is not new to the 0.98 architecture. 0.91 also uses Bboxes for data limits and does not directly share the x- or y-limits: they are updated using callbacks when the limits change. The difference in 0.98 is that the references between axes are set up (effectively) bidirectionally so there's no longer a notion of a "controlling" axes and "following" axes. It was easy in 0.91 to set up a situation where shared axes would only update if one, but not both, of the pair were zoomed/panned, and that bug has been fixed.
Back when the 0.98 transformations were being written, John and I had a long discussion about whether data limits should be Bbox-like or pair-of-intervals-like, and we ultimately decided to leave things as-is to avoid creating too much newness at once. IMHO, however, the real problem is that the shared axes mechanism doesn't know whether the limits are changing because of autoscaling (in which case the limits should be unioned together), or panning/zooming, in which case the limits need to be replaced. The second problem is probably necessary to fix whether we use Bboxes or not.
Cheers,
Mike
Thanks Michael and Eric for your constructive replies and your help.
It is know clear for me why my code was luckily working with 0.91 but not with 0.98. This is certainly going to help me finding a robust solution for both cases.
Regards,
David
Michael Droettboom a �crit :
···
David,
There is no code in matplotlib to autoscale shared axes, and as far as I know, there never has been. Unfortunately, it's more or less a requirement that you have to set the limits manually when using shared axes. (All of the shared axes examples do this).
I think, 0.91 is broken also, it just happens to use the first plotted line rather than the second (it truncates the red line, rather than the blue one). The difference in ordering is due to the fact that sharing is now always bi-directional in 0.98 and it uses dictionaries with a somewhat random ordering, rather than lists. If you see different behavior than my plots (attached) let me know.
Eric Firing wrote:
This looks like a rather fundamental problem in the present architecture. I thought I had a solution figured out, but I was wrong, and now I am not confident that I can come up with a good solution quickly. Some consultation with, or intervention by, Mike D. may be needed--he might even see a solution in a matter of minutes. The problem is that the dataLim for each axes object is a Bbox, and in this implementation there is no way to share an x-interval or a y-interval among Bboxes. So there is a single xaxis major locator that is shared, but it is only getting its dataLim updated from one of the shared axes.
Just to clarify: this limitation is not new to the 0.98 architecture. 0.91 also uses Bboxes for data limits and does not directly share the x- or y-limits: they are updated using callbacks when the limits change. The difference in 0.98 is that the references between axes are set up (effectively) bidirectionally so there's no longer a notion of a "controlling" axes and "following" axes. It was easy in 0.91 to set up a situation where shared axes would only update if one, but not both, of the pair were zoomed/panned, and that bug has been fixed.
Back when the 0.98 transformations were being written, John and I had a long discussion about whether data limits should be Bbox-like or pair-of-intervals-like, and we ultimately decided to leave things as-is to avoid creating too much newness at once. IMHO, however, the real problem is that the shared axes mechanism doesn't know whether the limits are changing because of autoscaling (in which case the limits should be unioned together), or panning/zooming, in which case the limits need to be replaced. The second problem is probably necessary to fix whether we use Bboxes or not.
Cheers,
Mike
------------------------------------------------------------------------
------------------------------------------------------------------------