Hi All.
I am trying to create a circumplex (or “rose”) plot that looks a bit like this:
http://www.organizacionakultura.net/slike_fck/image/Ideal%20culture%20profile%20ENG(1).jpg
.jpg)
At the moment I am using a Polar plot and trying to manipulate it so that it looks more like a circumplex (with each “slice of the cake” corresponding to a label).
I want to change the color of the ticklines set by set_thetagrids(), but I am not having any luck.
( See black instead of green ticklines here: http://i1234.photobucket.com/albums/ff405/dbathory/circum.png )
Should I be able manipulating the ticklines in this way after calling set_theagrids?
for line in ax.xaxis.get_ticklines():
line.set_color(‘g’)
I’ve also tried using the tick_params() call to set the default tickline color, with no luck.
I’ve tried this on matplotlib v1.00 and v98.1, with the same results (black instead of green).
Full code:
#============== START CODE =====================
#!/usr/bin/python
import numpy as np
import matplotlib
matplotlib.use(‘Agg’)
import matplotlib.pyplot as plt
from matplotlib.projections.polar import PolarAxes
import matplotlib.cm as cm
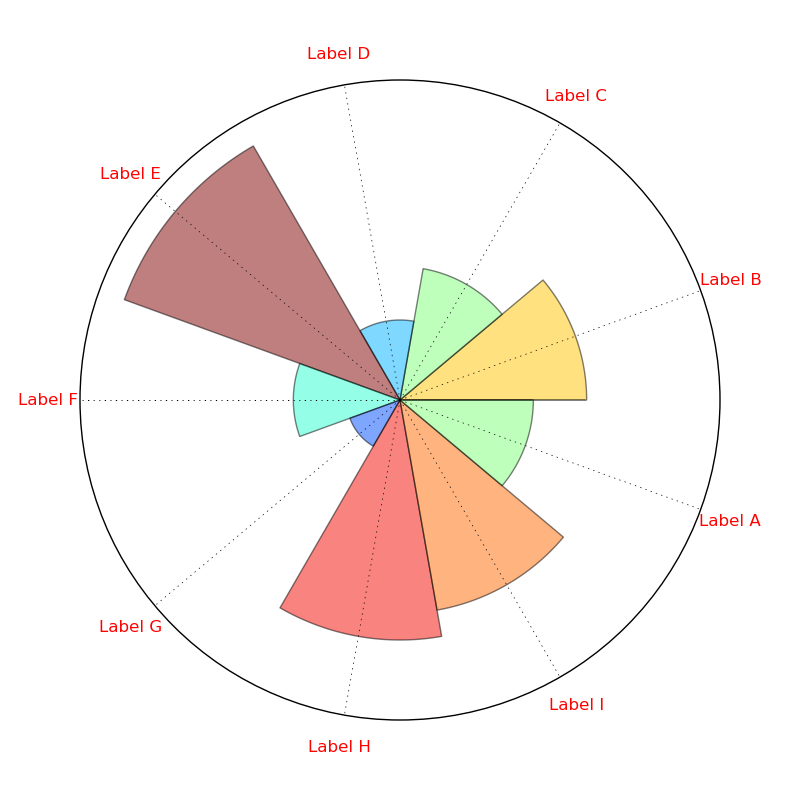
labels = [‘Label A’, ‘Label B’, ‘Label C’, ‘Label D’, ‘Label E’, ‘Label F’, ‘Label G’, ‘Label H’, ‘Label I’ ]
data = [ 7, 5, 3, 11, 4, 2, 9, 8, 5 ]
max_size = 12
N = len(data)
This doesn’t seem to change the tick color
plt.tick_params(axis=‘both’, which=‘both’, color=‘g’)
fig = plt.figure(figsize=(8,8))
ax = fig.add_axes([0.1, 0.1, 0.8, 0.8], polar=True)
theta = np.arange(0.0, 2np.pi, 2np.pi/N)
radii = data
width = np.pi*2/N
bars = ax.bar(theta, radii, width=width, bottom=0.0)
for r,bar in zip(radii, bars):
bar.set_facecolor( cm.jet(r/10.))
bar.set_alpha(0.5)
spoke_angles = theta * 180/np.pi - 180/N
(g_lines, g_labels) = ax.set_thetagrids(spoke_angles, labels, color=‘r’)
for line in ax.xaxis.get_ticklines():
line.set_color(‘g’) # This doesn’t seem to change the tick color either
ax.set_rgrids([10000], ) # Just moving the rgrids out the way for now
fig.savefig(‘circum.png’)
#============== END CODE =====================
Thanks in advance.