> > Is there a way to set the size of a polar plot (similar
> > to the axis argument to the plot command for a
> > rectangular plot)? Thanks.
>
> Hmmm. I do not believe the plot command takes an axis argument.
>
> Do you mean the "axes" and "subplot" commands which are used to set
> the size of the Axes that contains the plot? If so, just pass
> polar=True to them, as in
>
> subplot(111, polar=True)
> axes([0.2, 0.2, 0.7, 0.7], polar=True)
>
> I am updating the axes doc string.
>
> API users, note that the same applies to fig.add_axes and
> fig.add_subplot.
>
> JDH
Thanks for the response.
I have a plot that has a maximum magnitude of about 0.2. I'd like to set the
radius of the plot circle to 1.
Stephen
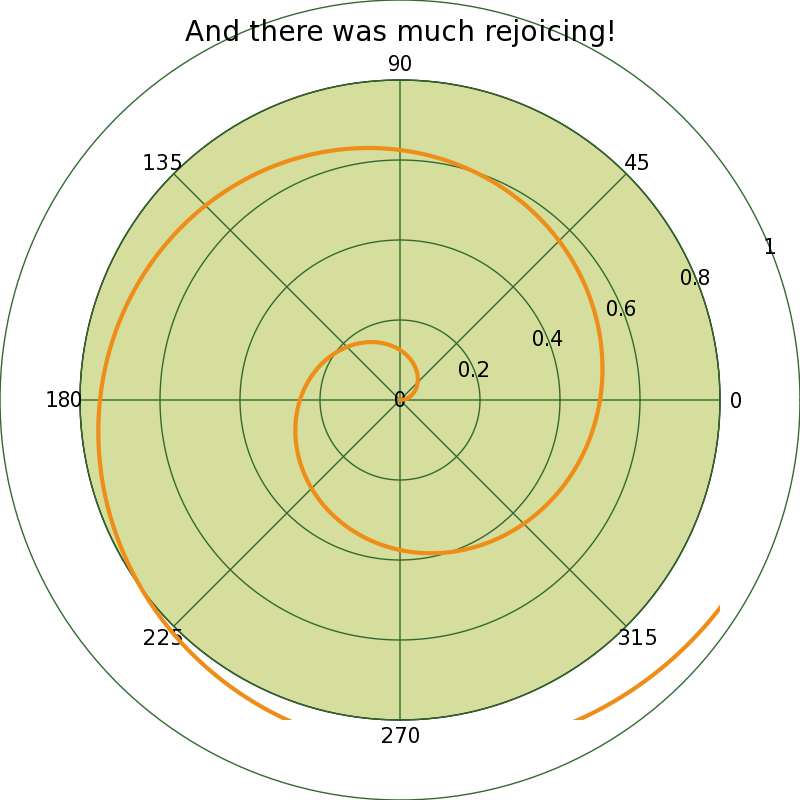
FYI: Here's a sample script for the bug report (if I understand what you're trying to do).
Add the following line to the polar_demo.py right before show:
ax.set_rmax( .8 )
And then you get the attached picture. It looks like the polar axis doesn't respond to changes in the maximum radial value to display (even though the axis implements the set_rmax method just for that).
Ted
···
At 12:38 PM 9/30/2005, Stephen Boulet wrote:
Thanks for the response.
I have a plot that has a maximum magnitude of about 0.2. I'd like to set the
radius of the plot circle to 1.
Stephen
-------------------------------------------------------
This SF.Net email is sponsored by:
Power Architecture Resource Center: Free content, downloads, discussions,
and more. http://solutions.newsforge.com/ibmarch.tmpl
_______________________________________________
Matplotlib-users mailing list
Matplotlib-users@lists.sourceforge.net
matplotlib-users List Signup and Options