Hello, I'm new to matplotlib and this list.
> Congratulation to the developers of this great package,
> I've been looking for a long while for a good quality
> plotting package.
> I would like to plot time in hours on the x axis, with
> one minor grid per 15 minutes and one major grid per
> hour, but I can only see 10 fixed grids on all tutorial
> and documentation.
> How can I configure that?
No support for minor and major ticks yet, but I can add it pretty
quickly, probably for the next release due out soon. I just need a
little information. How do grids interact with major and minor ticks?
I know major ticks are generally bigger and are labeled, and minor
ticks are smaller and not labeled, but I don't know how grid lines are
usually handled with respect to major and minor ticks. If you have a
link to a canonical figure which uses major and minor ticks, I can
follow that example.
JDH
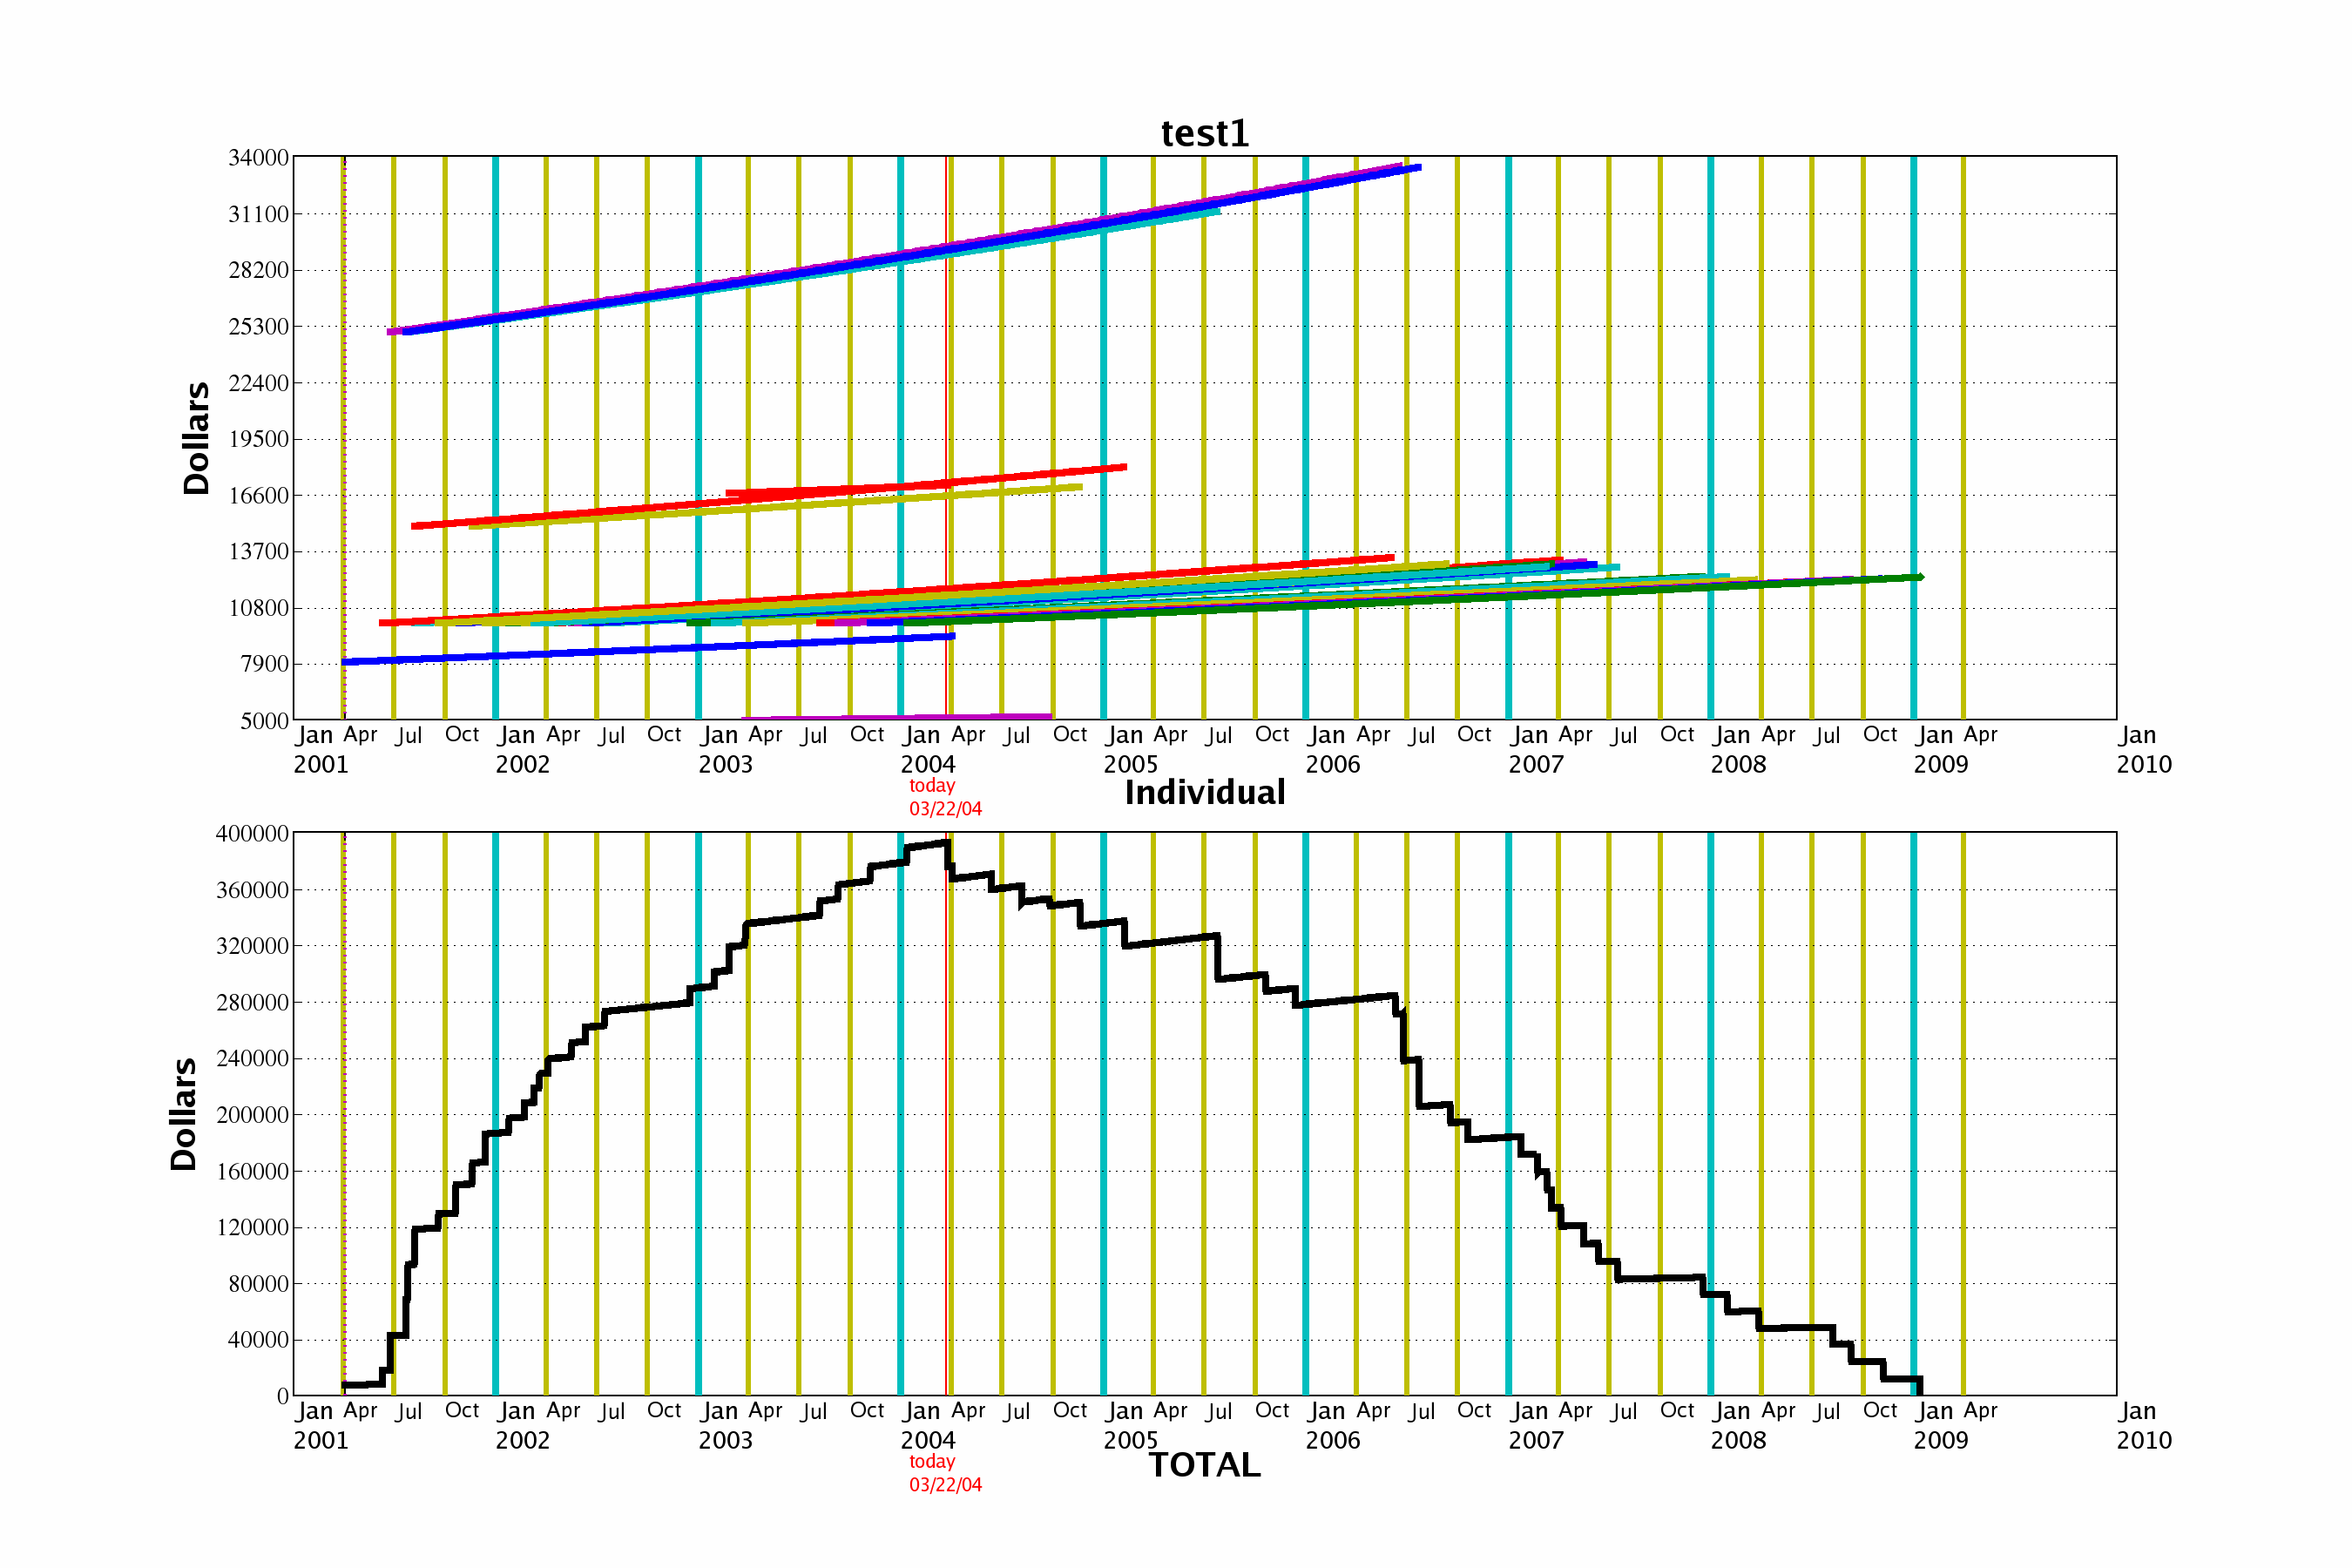
I've also been playing around with plots versus time (in my case
calendar time) and experimenting with tick style and ticklabel placement
computed as a function of the time span.
I attached a plot of one of my experiments. (This is where the need for
multi-line ticklabels comes from.)
The ticks and ticklabels that one wants differ according to the span of
time plotted. For instance, for multi-year plots, the ticks are no finer
than quarterly, but adjust to monthly, weekly, or daily if the span is
sub-year. The tick placement is, of course, not uniform, because of the
irregularities in the calendar.
I have not experimented with sub-day time-spans of the kind shown by
Philippe.
-Al Schapira
···
On Tue, 2004-04-13 at 10:12, John Hunter wrote:
> Hello, I'm new to matplotlib and this list.
> Congratulation to the developers of this great package,
> I've been looking for a long while for a good quality
> plotting package.
> I would like to plot time in hours on the x axis, with
> one minor grid per 15 minutes and one major grid per
> hour, but I can only see 10 fixed grids on all tutorial
> and documentation.
> How can I configure that?
No support for minor and major ticks yet, but I can add it pretty
quickly, probably for the next release due out soon. I just need a
little information. How do grids interact with major and minor ticks?
I know major ticks are generally bigger and are labeled, and minor
ticks are smaller and not labeled, but I don't know how grid lines are
usually handled with respect to major and minor ticks. If you have a
link to a canonical figure which uses major and minor ticks, I can
follow that example.
JDH