Hello there,
using matplotlib 0.99, I have a problem with colorbars, which is illustrated
by the following code:
---8<-------
from matplotlib import ticker
import numpy as np
a = np.arange(676).reshape((26,26))
x = y = np.arange(26)
colorMap = mpl.cm.get_cmap('jet', 10)
colorNorm = mpl.colors.Normalize(vmin=0, vmax=400,clip=True)
plot = contourf(x,y,a,10,cmap=colorMap,norm=colorNorm, \
locator=ticker.LinearLocator(10))
cb = colorbar(plot,orientation='horizontal',cmap=colorMap,norm=colorNorm, \
extend='neither',spacing='uniform')
---8<-------
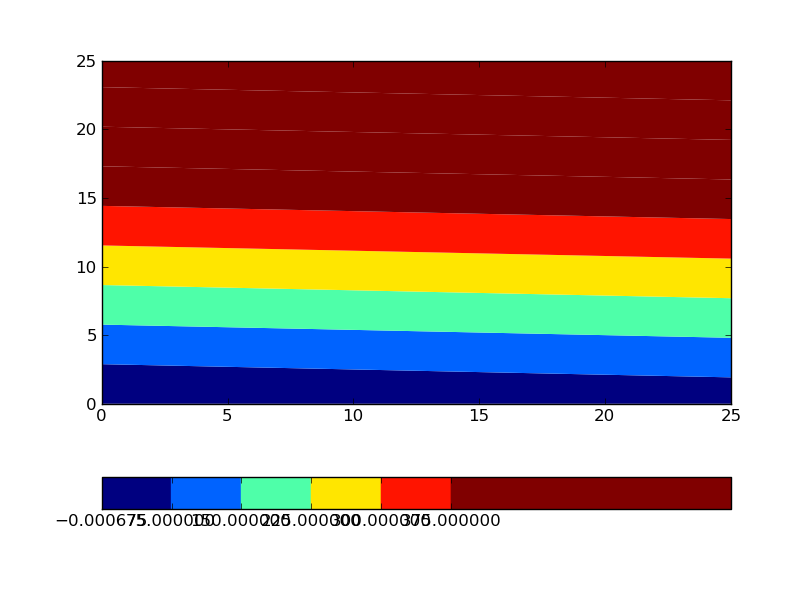
So I have data ranging from 0 up to say 675. I want to create a contour plot,
but the colorbar should only go up to 400, and all values higher than that
should be shown in the color of the maximum value 400, which is working
fine.
However, the colorbar does not go from 0 to 400, but rather from 0 to 675:
---8<-------
In [52]: cb._boundaries
Out[52]:
array([ -6.75000000e-04, 7.50000000e+01, 1.50000000e+02,
2.25000000e+02, 3.00000000e+02, 3.75000000e+02,
4.50000000e+02, 5.25000000e+02, 6.00000000e+02,
6.75000675e+02])
---8<-------
The colors shown are correct, but the colorbar looks ugly, because two
thirds
of it are filled with the color of the maximum value.
According to the documentation
(http://matplotlib.sourceforge.net/api/colors_api.html#matplotlib.colors.Normalize):
If clip is True and the given value falls outside the range, the
returned
value will be 0 or 1, whichever is closer.
So my question is: What do I need to do so that the colorbar actually has
the
range as specified by my colorNorm?
Thanks for your help,
Andreas.