Hi all.
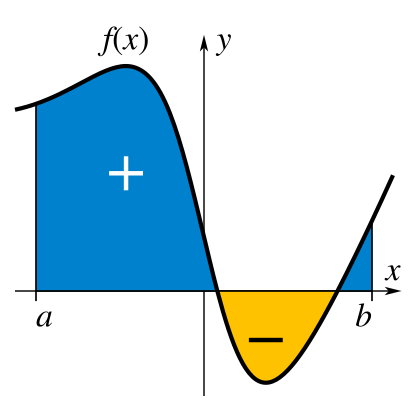
Is it possiblle in matplotlib to draw something like this?
http://upload.wikimedia.org/wikipedia/commons/thumb/9/9f/Integral_example.svg/420px-Integral_example.svg.png
Thanks.
Petro.
Have a look at fill_between: http://matplotlib.sourceforge.net/api/pyplot_api.html#matplotlib.pyplot.fill_between
Basically, You’d want something like this:
import matplotlib.pyplot as plt
import numpy as np
x = np.linspace(0, np.pi, 20)
y = np.sin(x)
plt.figure()
plt.fill_between(x, y, where=y>0, facecolor=‘blue’, interpolate=True)
plt.fill_between(x, y, where=y<0, facecolor=‘yellow’, interpolate=True)
plt.show()
Hope that helps!
-Joe
···
On Mon, Sep 27, 2010 at 8:10 AM, Piter_ <x.piter@…287…> wrote:
Hi all.
Is it possiblle in matplotlib to draw something like this?
http://upload.wikimedia.org/wikipedia/commons/thumb/9/9f/Integral_example.svg/420px-Integral_example.svg.pngThanks.
Petro.
Start uncovering the many advantages of virtual appliances
and start using them to simplify application deployment and
accelerate your shift to cloud computing.
http://p.sf.net/sfu/novell-sfdev2dev
Matplotlib-users mailing list
Matplotlib-users@lists.sourceforge.net
https://lists.sourceforge.net/lists/listinfo/matplotlib-users
http://matplotlib.sourceforge.net/examples/pylab_examples/fill_between_demo.html
hth,
Alan Isaac
···
On 9/27/2010 9:10 AM, Piter_ wrote:
Is it possiblle in matplotlib to draw something like this?
http://upload.wikimedia.org/wikipedia/commons/thumb/9/9f/Integral_example.svg/420px-Integral_example.svg.png