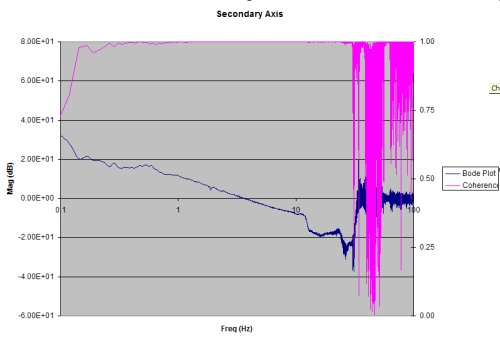
If it helps clarify what I mean, attached is a plot I made in excel (I
really don't want to use excel). The y-xis on the left goes from -60 to
80. The one on the right goes from 0-1.
Ryan
Ryan Krauss wrote:
···
Is it possible to overlay two plots with different y-axis limit? I think excel calls this plotting a data set with a secondary y-axis. I want to overlay a bode plot with its coherence and the y-axis limits for the two will be very different. I don't want to plot one above the other with a subplot, but actually overlay them on the same plot.
(and I want to do it on a semilogx).
Thanks,
Ryan
-------------------------------------------------------
This SF.Net email is sponsored by:
Power Architecture Resource Center: Free content, downloads, discussions,
and more. http://solutions.newsforge.com/ibmarch.tmpl
_______________________________________________
Matplotlib-users mailing list
Matplotlib-users@lists.sourceforge.net
matplotlib-users List Signup and Options
It appears that this feature is available through the twinx() function according to:
http://matplotlib.sourceforge.net/faq.html#TWOSCALES
(the link on this page is broken, but I have the file in some examples I downloaded from somewhere else on the matplotlib page.)
I created the second plot using:
figure(1)
subplot(211)
ax2=pylab.twinx()
pylab.semilogx(freq,iobode.coh,'k')
It seems like once I called the twinx function, the x-axis settings that where on the original axis are ignored and I can't seem to change the axis settings. pylab.axes([0.1,30,0,1]) returned an error: RuntimeError: Transformation is not invertible
I tried calling the ax2.set_xlim((0.1,30)) function but it doesn't seem to do anything.
Ryan
Ryan Krauss wrote:
···
If it helps clarify what I mean, attached is a plot I made in excel (I
really don't want to use excel). The y-xis on the left goes from -60 to
80. The one on the right goes from 0-1.
Ryan
Ryan Krauss wrote:
Is it possible to overlay two plots with different y-axis limit? I think excel calls this plotting a data set with a secondary y-axis. I want to overlay a bode plot with its coherence and the y-axis limits for the two will be very different. I don't want to plot one above the other with a subplot, but actually overlay them on the same plot.
(and I want to do it on a semilogx).
Thanks,
Ryan
-------------------------------------------------------
This SF.Net email is sponsored by:
Power Architecture Resource Center: Free content, downloads, discussions,
and more. http://solutions.newsforge.com/ibmarch.tmpl
_______________________________________________
Matplotlib-users mailing list
Matplotlib-users@lists.sourceforge.net
matplotlib-users List Signup and Options
------------------------------------------------------------------------