On my primary x axis, I have the continuous timestamps.
On my y axis I have the recordings of my desired variable.
On my secondary x axis, I need to have the timestamps where my “events” happened.
I get the ticks and labels of these events from another data frame, other than my main data frame.
I try to plot all of these, this way:
The labels are plotted correctly where the ticks are, but I lose the main timestamps on my primary x axis, and some random 0 to 1 scale is plotted.
When I plot my main data using ax1.plt or ax2.plot (instead of plt.plot), I get the timestamps on my primary x axis, but then the ticks and labels are shown incorrectly.
Any idea what I’m doing wrong?
I can provide more information or more chunks of my script, if needed.
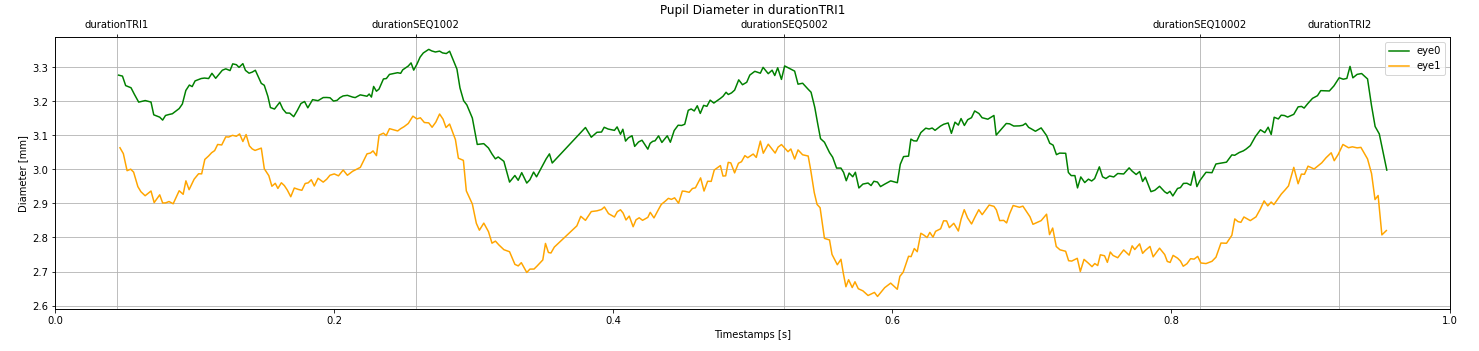
First figure is when I plot my main data using plt.plot
and I get correct ticks and labels (ticks and labels correctly shown as they happened in this one trial of data),
but incorrect timestamps on the primary x axis.
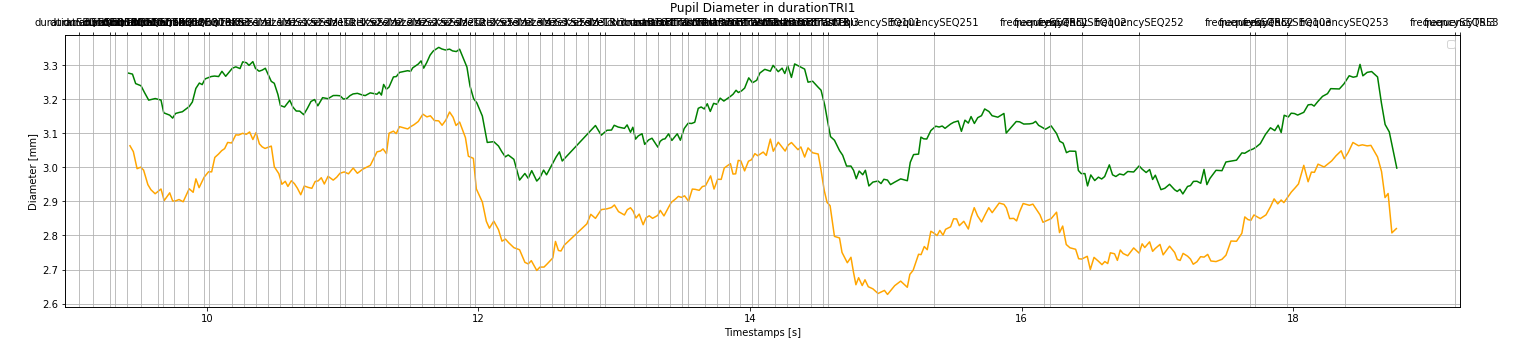
Second figure is when I plot my main data using ax1.plot
and I get correct timestamps on primary x axis,
but incorrect ticks and labels (the whole run’s ticks and labels are shown for this one trial of data).
Sorry I’m new here and I don’t know what dummy data means, but here are screen shots of my data.
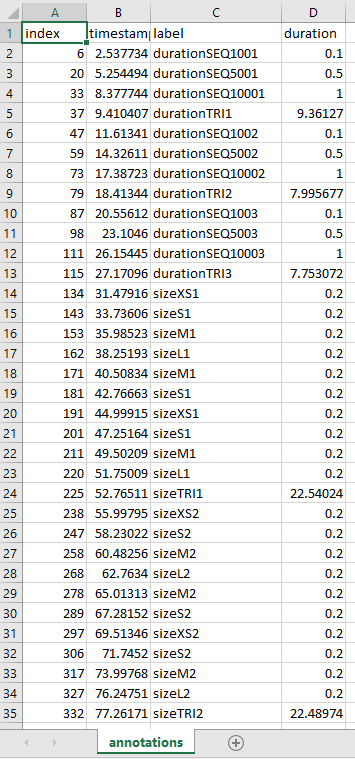
Third figure is my annotations, where I get the ticks and labels about the events,
Fourth figure is my main data with the timestamps and the main variable.
dummy data means fake data. And sorry, I totally glossed over that your code was plt.plot which essentially is going to plot both on the same axis, ignoring the twinning.
What happens when you plot:
<ipython-input-3-0080cafff77e>:263: MatplotlibDeprecationWarning: Passing the minor parameter of set_ticks() positionally is deprecated since Matplotlib 3.2; the parameter will become keyword-only two minor releases later.
  ax2.set_xticks(ticks, labels)
---------------------------------------------------------------------------
ValueError                                Traceback (most recent call last)
<ipython-input-3-0080cafff77e> in <module>
    261         ax1.plot(pupil_data_in_trial_eye1['pupil_timestamp'].loc[pupil_data_in_trial_eye1['trial'] == trial_label], pupil_data_in_trial_eye1['diameter_3d'].loc[pupil_data_in_trial_eye1['trial'] == trial_label])
    262
--> 263         ax2.set_xticks(ticks, labels)
    264
    265 #         plt.xticks(ticks.loc[annotations_pd_frame['label'] == trial_label], labels.loc[annotations_pd_frame['label'] == trial_label])

~\anaconda3\lib\site-packages\matplotlib\axes\_base.py in wrapper(self, *args, **kwargs)
     61
     62         def wrapper(self, *args, **kwargs):
---> 63             return get_method(self)(*args, **kwargs)
     64
     65         wrapper.__module__ = owner.__module__

~\anaconda3\lib\site-packages\matplotlib\cbook\deprecation.py in wrapper(*args, **kwargs)
    449                 "parameter will become keyword-only %(removal)s.",
    450                 name=name, obj_type=f"parameter of {func.__name__}()")
--> 451         return func(*args, **kwargs)
    452
    453     return wrapper

~\anaconda3\lib\site-packages\matplotlib\axis.py in set_ticks(self, ticks, minor)
   1814                 self.set_view_interval(max(ticks), min(ticks))
   1815         self.axes.stale = True
-> 1816         if minor:
   1817             self.set_minor_locator(mticker.FixedLocator(ticks))
   1818             return self.get_minor_ticks(len(ticks))

~\anaconda3\lib\site-packages\pandas\core\generic.py in __nonzero__(self)
   1327
   1328     def __nonzero__(self):
-> 1329         raise ValueError(
   1330             f"The truth value of a {type(self).__name__} is ambiguous. "
   1331             "Use a.empty, a.bool(), a.item(), a.any() or a.all()."

ValueError: The truth value of a Series is ambiguous. Use a.empty, a.bool(), a.item(), a.any() or a.all().
can you please provide some sample data in a runnable form (so for example as a CSV?). That error seems to be complaining about the data sent to set_xticks
can you please post the figure you get?
for me it still gives this one, with all the labels all in one trial, and not spread through all the trials where they happened:
So when I ran your code, trial_label was undefined and I guessed at pupil_data_in_trial_eye1 and pupil_data_in_trial_eye2, so I wasn’t able to reproduce your original and was just trying to get the labels to show up.
If they’re still misaligned, I wonder if it might work if you merge the annotation dataframe to the trial data frames so everything is on a shared index.