I have the following code. I want to plot error bars representing the standard error of the mean on the graphs below. However, when I run the code, I get the error: ‘Line2D’ object has no property ‘errorbar’
fig, axes = plt.subplots(nrows=2,figsize=(15, 15))
fig.tight_layout(pad=6)
newerdf=newdf.copy()
bins = [0, 2, 4, 6, 8]
names = ['<2', '2-4', '4-6', '6-8', '8+']
d = dict(enumerate(names, 1))
newerdf['caffeinatedbeveragesperdayrange'] = np.digitize(newerdf['caffeinatedbeveragesperday'], bins)
newerdf['caffeinatedbeveragesperdayrange'] = newerdf['caffeinatedbeveragesperdayrange'].map(d)
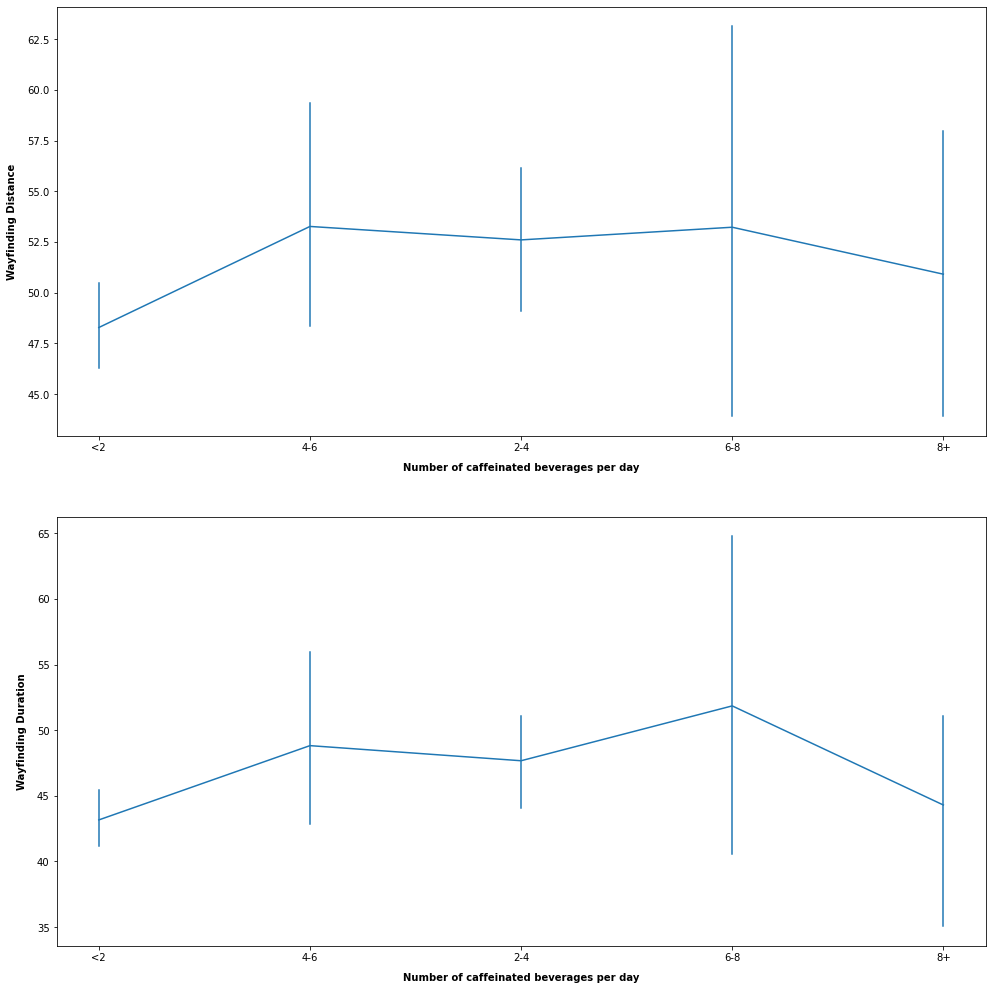
Graph1 = sns.lineplot(data=newerdf,x="caffeinatedbeveragesperdayrange", y="distance",err_style='bars',errorbar ='se',ax=axes[0])
Graph2 = sns.lineplot(data=newerdf,x="caffeinatedbeveragesperdayrange", y="duration",err_style='bars',errorbar ='se',ax=axes[1])
Graph1.set_xlabel( "Number of caffeinated beverages per day",labelpad = 10,weight='bold')
Graph2.set_xlabel( "Number of caffeinated beverages per day",labelpad = 10,weight='bold')
Graph1.set_ylabel("Wayfinding Distance",labelpad = 10,weight='bold')
Graph2.set_ylabel("Wayfinding Duration",labelpad = 10,weight='bold')
I would be so grateful a helping hand!
The first 6 rows of the newerdf['caffeinatedbeveragesperdayrange'],newerdf['distance'] and newerdf['duration'] dataframes:
caffeinatedbeveragesperdayrange
10  <2
13  4-6
17  2-4
19  <2
21  <2
22  <2

distance
10  48.146090
13  98.877301
17  66.670310
19  95.764316
21  78.737108
22  48.404197

    duration
10  40.976006
13  90.093298
17  88.349603
19  82.737323
21  72.579054
22  40.059987