Hi,
I have a recurrent problem when trying to put some plots in pdf format.
Searching in this mailing list and google I haven't been able to find a
reasonable answer to this problem, and was wondering if someone could
point me in the right direction.
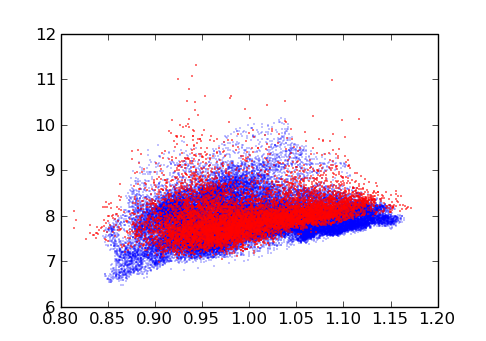
The problem is the following. When saving to pdf matplotlib saves as a
vectorial pdf -- which is great. However I have some scatter plots that
have a lot of points (~ 400.000, see attached example in png). When I
save this into pdf the file is massive and takes a lot of time to open
in a reader. Since I don't really need the vectorial data for this
scatter plot, I was wondering if there was a way to still save as pdf
but keep the plot itself as a raster, instead of the full data. Why save
as pdf? Because I'd still like to have the scalable fonts. This is for a
publication, so it's much more harmonious to have the latex bits in the
plot as pdf.
I have developed an intermediate solution. I have done a high-resolution
2D histogram of the data and using imshow and a suitable colormap,
plotted that. For example in the blue points in the example I can get a
very good match on the screen. However I can only plot one set of data.
If I want to use other data in a different colour this doesn't work,
since another imshow will cover the original data. Unless there is the
option to have a transparent colour in the colormap, which I doubt.
Do you have any ideas on how I could rasterize a plot and still save it
as pdf?
Thanks!
Tiago
Tiago Pereira wrote:
Hi,
I have a recurrent problem when trying to put some plots in pdf format.
Searching in this mailing list and google I haven't been able to find a
reasonable answer to this problem, and was wondering if someone could
point me in the right direction.
The problem is the following. When saving to pdf matplotlib saves as a
vectorial pdf -- which is great. However I have some scatter plots that
have a lot of points (~ 400.000, see attached example in png). When I
save this into pdf the file is massive and takes a lot of time to open
in a reader. Since I don't really need the vectorial data for this
scatter plot, I was wondering if there was a way to still save as pdf
but keep the plot itself as a raster, instead of the full data. Why save
as pdf? Because I'd still like to have the scalable fonts. This is for a
publication, so it's much more harmonious to have the latex bits in the
plot as pdf.
I have developed an intermediate solution. I have done a high-resolution
2D histogram of the data and using imshow and a suitable colormap,
plotted that. For example in the blue points in the example I can get a
very good match on the screen. However I can only plot one set of data.
If I want to use other data in a different colour this doesn't work,
since another imshow will cover the original data. Unless there is the
option to have a transparent colour in the colormap, which I doubt.
Do you have any ideas on how I could rasterize a plot and still save it
as pdf?
What you need is mixed-mode rendering, which mpl has, but without an API...
http://www.mail-archive.com/matplotlib-devel@lists.sourceforge.net/msg02659.html
http://www.mail-archive.com/matplotlib-devel@lists.sourceforge.net/msg04689.html
There is at least one other recent reference to this, but I haven't found it.
Eric