I’ve also done some additional testing to see if I could figure out what
was going on, and it turns out that it’s not just a problem with eps files. This problem also occurs in the other vector graphics formats, ps/eps/pdf/svg. In all cases the entire image is actually contained within the file, it’s just shifted and clipped. Sometimes it’s shifted so much that none of it is within the axes window and thus the entire image gets clipped and it appears not to be there at all.
I also discovered that the time axis isn’t actually a factor.
I’ve also noticed that using interpolation seems to make a difference. When I use the default interpolation the plots seem to come out fine, although some of my other data do look a little bit shifted, but that could be some other effect.
Another weird thing that I’ve noticed is that different viewers interpret this shifting in different ways. For example, the pdfs all look fine when I view them in Okular, but are shifted in xpdf. (At some point I submitted a second email to the list re: this problem that had screenshots attached. I don’t know if it ever made it through however.)
I’ll submit the but report on the git tracker.
Round-off error could make sense.
–Chad
Here’s my most recent set of test code:
import matplotlib.pyplot as plt
from matplotlib.colors import LogNorm
imgData = [[1.0/(x) + 1.0/(y) for x in range(1,100)] for y in range(1,100)]
tMin=734717.945208
tMax=734717.946366
Case 0: Works
Case0={“id”:0,
“interp”:None,
“extents”:(tMin,tMax,1,100)}
Case 1: Works
Case1={“id”:1,
“interp”:“none”,
“extents”:(1,100,1,100)}
Case 2: Doesn’t work
Case2={“id”:2,
“interp”:“none”,
“extents”:(tMin,tMax,1,100)}
for Case in (Case2, Case1, Case0):
plt.figure(Case[“id”])
axImg=plt.subplot(111)
axImg.imshow(imgData,
norm=LogNorm(),
interpolation=Case[“interp”],
extent=Case[“extents”])
axImg.set_aspect(‘auto’)
for filetype in ["png", "eps", "pdf", "svg"]:
    plt.savefig("imageshift-Case{0}.{1}".format(Case["id"], filetype))
···
On Tue, Aug 14, 2012 at 3:19 AM, Eric Firing <efiring@…202…> wrote:
On 2012/08/13 3:58 PM, Benjamin Root wrote:
On Thu, Aug 2, 2012 at 7:21 PM, Chad Parker <parker.charles@…287… > > mailto:parker.charles@...287...> wrote:
Hello everyone-
I'm a new Python/Matplotlib user, but I have quite a bit of plotting
experience with octave/matlab and gnuplot. So, I apologize in
advance if my python style is terrible and if I give you all the
wrong information!
I'm having a problem saving figures that contain images as eps files
when my x-axis is a date/time axis. The trouble is that in the
resulting eps file, the image data is shifted relative to the axis.
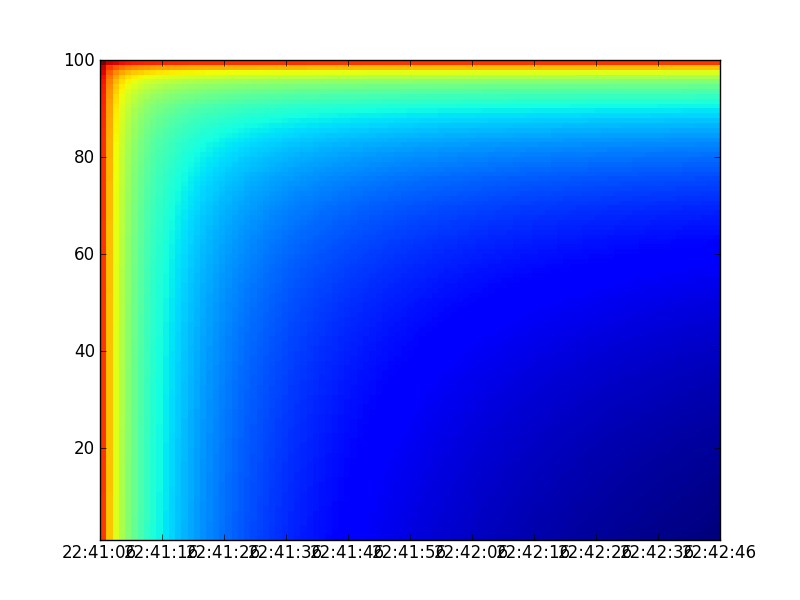
I've attached two images as an example. In the .png file the
alignment is correct and in the eps file it's not. The png is also
nearly identical to what I get when I plot to the screen. The script
I wrote to generate these plots is at the end of this message.
It's worth noting that the two output images are identical if the
x-axis is simply numerical and not a time series.
I'm using python 2.7.3 and Matplotlib 1.1.0
Some Google searches dug up this old thread, however, the shift that
I'm experiencing seems to be much greater, so I don't know if it's
related:
[http://old.nabble.com/Saving-as-eps-file-shifts-image--td29232680.html](http://old.nabble.com/Saving-as-eps-file-shifts-image--td29232680.html)
Can anyone help me solve this?
Thanks in advance,
--Chad
Here is a minimal script that I used to generate these plots:
import matplotlib.pyplot as plt
import matplotlib.dates as dts
from matplotlib.colors import LogNorm
imgData = [[1.0/x + 1.0/y for x in range(1,100)] for y in range(1,100)]
tMin=dts.epoch2num(1343947266)
tMax=dts.epoch2num(1343947266+100)
axImg=plt.subplot(111)
axImg.imshow(imgData, norm=LogNorm(),extent=(tMin,tMax,1,100),\
interpolation='none', origin="upper")
axImg.xaxis_date()
axImg.set_aspect('auto')
plt.savefig("imageshift.png")
plt.savefig("imageshift.eps")
Confirmed. This is a fairly nasty-looking result. And I am not exactly
sure what is happening here. Note that it does not matter if the png or
the eps images were saved first. It looks like an auto-scaling bug, but
given that it doesn’t impact the png image, I am not so sure.
This appears to be some sort of truncation error bug; it has nothing to
do with dates. Here is a modified illustration:
import matplotlib.pyplot as plt
from matplotlib.colors import LogNorm
imgData = [[1.0/x + 1.0/y for x in range(1,10)] for y in range(1,10)]
tMin = 1000000066 # Shifted by half
tMin = 100000066 # Blank!
tMin = 10000066 # OK
tMax = tMin+10
The following combination is also shifted by half
tMin = 10000066.1 # adding the 0.1 doesn’t make a difference
tMax = tMin+1
print tMin, tMax
axImg=plt.subplot(111)
axImg.imshow(imgData, norm=LogNorm(), extent=(tMin,tMax,1,10),
interpolation=‘none’, origin=“upper”)
axImg.set_aspect(‘auto’)
plt.savefig(“imageshift.png”)
plt.savefig(“imageshift.eps”)
plt.savefig(“imageshift.pdf”)
I thought it might come from the use of str() instead of repr() when
generating the concat matrix in the ps backend, but that’s not it. I’m
suspecting it may be inherent in the ps language, when one uses a matrix
to make an enormous translation in one direction, and then uses
translate to sling everything back in the other direction. Either that,
or some sort of “snapping” is going on.
Eric
Could you file a bug report on this at the github tracker? I would like
to see this fixed before the 1.2.0 release.
Thanks!
Ben Root
Live Security Virtual Conference
Exclusive live event will cover all the ways today’s security and
threat landscape has changed and how IT managers can respond. Discussions
will include endpoint security, mobile security and the latest in malware
threats. http://www.accelacomm.com/jaw/sfrnl04242012/114/50122263/
Matplotlib-users mailing list
Matplotlib-users@lists.sourceforge.net
https://lists.sourceforge.net/lists/listinfo/matplotlib-users