I am trying to save a matplotlib 2d array image with an overlaid contour as an eps file. The contour appears to be shifted with respect to the image underneath in the eps file, particularly when I zoom in on the image. This shift is not noticeable in the plot within matplotlib.
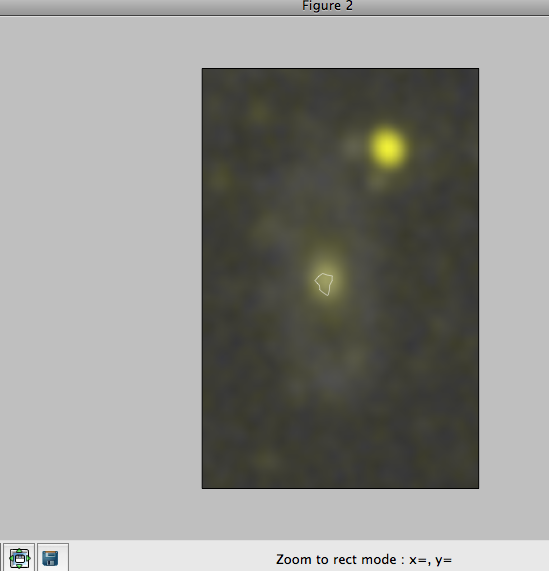
I am using imshow to display the image. The contour is created by plotting a list of closely-spaced x,y coordinates. The attached file matplotlib.png is a screenshot of the (zoomed-in) image as displayed by matplotlib. The attached file epsfile.png is a screenshot of the (zoomed-in) eps file. When I save this image as an eps file, it is actually 1 of 20 subplots and the shift is noticeable in each subplot.
Thanks in advance for your help!
Jenna

Just as a wild guess, could this actually be an issue with how imshow uses the upper-left corner for (0,0)? I have seen 1-pixel shifts before, but this shift is a little dramatic and I am left wondering if what we are really seeing is that the contour that is desired should actually be fliped in the y-axis?
Maybe you could try another example where you try to draw a contour further away from the center of the image and see if it still goes in the spot you expect it to be?
Ben Root
···
On Wed, Jul 21, 2010 at 3:40 PM, Jenna Lemonias <jenna@…2124…> wrote:
I am trying to save a matplotlib 2d array image with an overlaid contour as an eps file. The contour appears to be shifted with respect to the image underneath in the eps file, particularly when I zoom in on the image. This shift is not noticeable in the plot within matplotlib.
I am using imshow to display the image. The contour is created by plotting a list of closely-spaced x,y coordinates. The attached file matplotlib.png is a screenshot of the (zoomed-in) image as displayed by matplotlib. The attached file epsfile.png is a screenshot of the (zoomed-in) eps file. When I save this image as an eps file, it is actually 1 of 20 subplots and the shift is noticeable in each subplot.
Thanks in advance for your help!
Jenna
No, I don't think the issue is a flip in the y-axis. I have a number of different examples of this, and many in which the contour is an ellipse so I can tell that the overall positioning is correct. It seems like something is going wrong only when I save the image... Thanks for the suggestion though!
Jenna
:
> I am trying to save a matplotlib 2d array image with an overlaid contour as
> an eps file. The contour appears to be shifted with respect to the image
> underneath in the eps file, particularly when I zoom in on the image. This
> shift is not noticeable in the plot within matplotlib.
>
> I am using imshow to display the image. The contour is created by plotting
> a list of closely-spaced x,y coordinates. The attached file matplotlib.png
> is a screenshot of the (zoomed-in) image as displayed by matplotlib. The
> attached file epsfile.png is a screenshot of the (zoomed-in) eps file. When
> I save this image as an eps file, it is actually 1 of 20 subplots and the
> shift is noticeable in each subplot.
>
> Thanks in advance for your help!
>
> Jenna
>
>
Just as a wild guess, could this actually be an issue with how imshow uses
the upper-left corner for (0,0)? I have seen 1-pixel shifts before, but
this shift is a little dramatic and I am left wondering if what we are
really seeing is that the contour that is desired should actually be fliped
in the y-axis?
Maybe you could try another example where you try to draw a contour further
away from the center of the image and see if it still goes in the spot you
expect it to be?
Ben Root
···
On Wed, Jul 21, 2010 at 3:40 PM, Jenna Lemonias <jenna@…2124…>wrote
I tried a simple array (see the code below) but cannot reproduce the
problem you reported.
import matplotlib.pyplot as plt
import numpy as np
arr = np.zeros((11, 11), dtype="d")
arr[3,3]=1
im = plt.imshow(arr, interpolation="nearest", origin="lower")
cont = plt.contour(arr, levels=[0.5])
plt.savefig("a.eps")
Do you still see the shift with the above example code?
And what version of matplotlib are you using?
If possible, please post a complete script with the data (use a
mock-up data if you want)?
Regards,
-JJ
···
On Fri, Jul 23, 2010 at 12:16 AM, Jenna Lemonias <jenna@...2124...> wrote:
No, I don't think the issue is a flip in the y-axis. I have a number of
different examples of this, and many in which the contour is an ellipse so I
can tell that the overall positioning is correct. It seems like something
is going wrong only when I save the image... Thanks for the suggestion
though!
Jenna
On Wed, Jul 21, 2010 at 3:40 PM, Jenna Lemonias > <jenna@...2124...>wrote:
I am trying to save a matplotlib 2d array image with an overlaid contour
as
an eps file. The contour appears to be shifted with respect to the image
underneath in the eps file, particularly when I zoom in on the image.
This
shift is not noticeable in the plot within matplotlib.
I am using imshow to display the image. The contour is created by
plotting
a list of closely-spaced x,y coordinates. The attached file
matplotlib.png
is a screenshot of the (zoomed-in) image as displayed by matplotlib. The
attached file epsfile.png is a screenshot of the (zoomed-in) eps file.
When
I save this image as an eps file, it is actually 1 of 20 subplots and the
shift is noticeable in each subplot.
Thanks in advance for your help!
Jenna
Just as a wild guess, could this actually be an issue with how imshow uses
the upper-left corner for (0,0)? I have seen 1-pixel shifts before, but
this shift is a little dramatic and I am left wondering if what we are
really seeing is that the contour that is desired should actually be fliped
in the y-axis?
Maybe you could try another example where you try to draw a contour further
away from the center of the image and see if it still goes in the spot you
expect it to be?
Ben Root
------------------------------------------------------------------------------
This SF.net email is sponsored by Sprint
What will you do first with EVO, the first 4G phone?
Visit sprint.com/first -- http://p.sf.net/sfu/sprint-com-first
_______________________________________________
Matplotlib-users mailing list
Matplotlib-users@lists.sourceforge.net
matplotlib-users List Signup and Options
That looks fine to me too, but if you plot that as one subplot in a 5x5 array
of subplots or more, then you can see the shift I am talking about in the
eps file. Example:
import matplotlib.pyplot as plt
import numpy as np
arr = np.zeros((11, 11), dtype="d")
arr[3,3]=1
plt.figure(1)
plt.subplot(10,10,1)
im = plt.imshow(arr, interpolation="nearest", origin="lower")
cont = plt.contour(arr, levels=[0.5])
plt.savefig("a.eps")
Jae-Joon Lee wrote:
···
I tried a simple array (see the code below) but cannot reproduce the
problem you reported.
import matplotlib.pyplot as plt
import numpy as np
arr = np.zeros((11, 11), dtype="d")
arr[3,3]=1
im = plt.imshow(arr, interpolation="nearest", origin="lower")
cont = plt.contour(arr, levels=[0.5])
plt.savefig("a.eps")
Do you still see the shift with the above example code?
And what version of matplotlib are you using?
If possible, please post a complete script with the data (use a
mock-up data if you want)?
Regards,
-JJ
On Fri, Jul 23, 2010 at 12:16 AM, Jenna Lemonias > <jenna@...2124...> wrote:
No, I don't think the issue is a flip in the y-axis. I have a number of
different examples of this, and many in which the contour is an ellipse
so I
can tell that the overall positioning is correct. It seems like
something
is going wrong only when I save the image... Thanks for the suggestion
though!
Jenna
On Wed, Jul 21, 2010 at 3:40 PM, Jenna Lemonias >> <jenna@...2124...>wrote:
I am trying to save a matplotlib 2d array image with an overlaid contour
as
an eps file. The contour appears to be shifted with respect to the
image
underneath in the eps file, particularly when I zoom in on the image.
This
shift is not noticeable in the plot within matplotlib.
I am using imshow to display the image. The contour is created by
plotting
a list of closely-spaced x,y coordinates. The attached file
matplotlib.png
is a screenshot of the (zoomed-in) image as displayed by matplotlib.
The
attached file epsfile.png is a screenshot of the (zoomed-in) eps file.
When
I save this image as an eps file, it is actually 1 of 20 subplots and
the
shift is noticeable in each subplot.
Thanks in advance for your help!
Jenna
Just as a wild guess, could this actually be an issue with how imshow
uses
the upper-left corner for (0,0)? I have seen 1-pixel shifts before, but
this shift is a little dramatic and I am left wondering if what we are
really seeing is that the contour that is desired should actually be
fliped
in the y-axis?
Maybe you could try another example where you try to draw a contour
further
away from the center of the image and see if it still goes in the spot
you
expect it to be?
Ben Root
------------------------------------------------------------------------------
This SF.net email is sponsored by Sprint
What will you do first with EVO, the first 4G phone?
Visit sprint.com/first -- http://p.sf.net/sfu/sprint-com-first
_______________________________________________
Matplotlib-users mailing list
Matplotlib-users@lists.sourceforge.net
matplotlib-users List Signup and Options
------------------------------------------------------------------------------
The Palm PDK Hot Apps Program offers developers who use the
Plug-In Development Kit to bring their C/C++ apps to Palm for a share
of $1 Million in cash or HP Products. Visit us here for more details:
http://ad.doubleclick.net/clk;226879339;13503038;l?
http://clk.atdmt.com/CRS/go/247765532/direct/01/
_______________________________________________
Matplotlib-users mailing list
Matplotlib-users@lists.sourceforge.net
matplotlib-users List Signup and Options
--
View this message in context: http://old.nabble.com/Saving-as-eps-file-shifts-image--tp29232680p29288310.html
Sent from the matplotlib - users mailing list archive at Nabble.com.
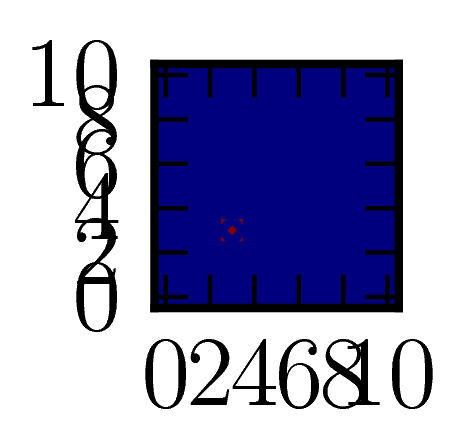
I still don't see it (a capture of my eps output is attached).
Can you post your output (original eps file that shows the shift)?
Again, what is your matplotlib version?
Regards,
-JJ
···
On Thu, Jul 29, 2010 at 1:17 AM, Jenna L. <jenna@...2124...> wrote:
That looks fine to me too, but if you plot that as one subplot in a 5x5 array
of subplots or more, then you can see the shift I am talking about in the
eps file. Example:
Hmm that is not what my output looks like. Attached is a capture of my
output. I am using matplotlib version 0.98.5.3
http://old.nabble.com/file/p29291928/shift_subplot_test.png
shift_subplot_test.png
Jae-Joon Lee wrote:
···
On Thu, Jul 29, 2010 at 1:17 AM, Jenna L. <jenna@...2124...> > wrote:
That looks fine to me too, but if you plot that as one subplot in a 5x5
array
of subplots or more, then you can see the shift I am talking about in the
eps file. Example:
I still don't see it (a capture of my eps output is attached).
Can you post your output (original eps file that shows the shift)?
Again, what is your matplotlib version?
Regards,
-JJ
------------------------------------------------------------------------------
The Palm PDK Hot Apps Program offers developers who use the
Plug-In Development Kit to bring their C/C++ apps to Palm for a share
of $1 Million in cash or HP Products. Visit us here for more details:
http://p.sf.net/sfu/dev2dev-palm
_______________________________________________
Matplotlib-users mailing list
Matplotlib-users@lists.sourceforge.net
matplotlib-users List Signup and Options
--
View this message in context: http://old.nabble.com/Saving-as-eps-file-shifts-image--tp29232680p29291928.html
Sent from the matplotlib - users mailing list archive at Nabble.com.
You version of mpl is pretty old. You’ll need to upgrade.
···
On Jul 28, 2010, at 6:55 PM, “Jenna L.” <jenna@…2124…> wrote:
Hmm that is not what my output looks like. Attached is a capture of my
output. I am using matplotlib version 0.98.5.3
http://old.nabble.com/file/p29291928/shift_subplot_test.png
shift_subplot_test.png