Hi,
I am using matplotlib to draw graphs. When I try to save a picture (using savefig; usually as png, but at some point I might need eps files as well), the actual graph comprises less than the central 50% of the image, the rest of the image is wasted space.
I already tried figure(frameon = False, facecolor = 'w') and box(False) to get rid of the redundant frame, but apparently it did not help (apart from removing the black frame, obviously, but what I want is to save only what is inside this frame).
Any ideas how to do this? If not, does anyone know a python tool that handles pngs and would enable me to crop the picture in a second step?
Arne
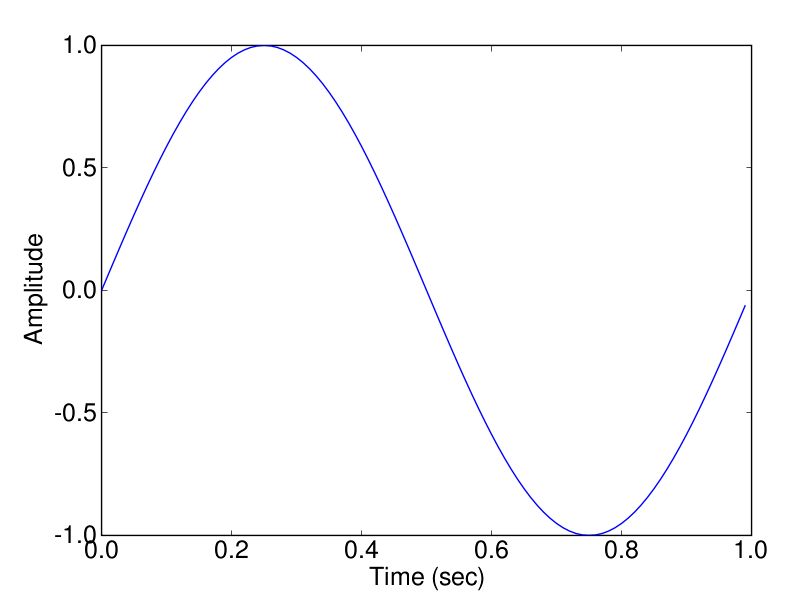
I don't think this is the default behavior. If I do
t=arange(0,1,0.01)
y=sin(2*pi*t)
plot(t,y)
xlabel('Time (sec)')
ylabel('Amplitude')
savefig('test.png')
I get the attached png without the extra border you describe.
Ryan
···
On 4/6/06, Arne.Bittig <arne.bittig@...1074...> wrote:
Hi,
I am using matplotlib to draw graphs. When I try to save a picture
(using savefig; usually as png, but at some point I might need eps files
as well), the actual graph comprises less than the central 50% of the
image, the rest of the image is wasted space.
I already tried figure(frameon = False, facecolor = 'w') and box(False)
to get rid of the redundant frame, but apparently it did not help (apart
from removing the black frame, obviously, but what I want is to save
only what is inside this frame).
Any ideas how to do this? If not, does anyone know a python tool that
handles pngs and would enable me to crop the picture in a second step?
Arne
-------------------------------------------------------
This SF.Net email is sponsored by xPML, a groundbreaking scripting language
that extends applications into web and mobile media. Attend the live webcast
and join the prime developer group breaking into this new coding territory!
http://sel.as-us.falkag.net/sel?cmd=lnk&kid=110944&bid=241720&dat=121642
_______________________________________________
Matplotlib-users mailing list
Matplotlib-users@lists.sourceforge.net
matplotlib-users List Signup and Options
Sorry, maybe I didn't make that clear enough.
I was talking about a graph as in "graph theory". Since there is no meaningful way to label the axes, and, in fact, no reason to show them at all, the white space I was talking about is just where in your picture there are the labels. So, looking at your example, what I'd like to have is what's inside the black rectangle, i.e. a png where the blue curve touches the top and the bottom of the image.
Arne
Ryan Krauss wrote:
···
I don't think this is the default behavior. If I do
t=arange(0,1,0.01)
y=sin(2*pi*t)
plot(t,y)
xlabel('Time (sec)')
ylabel('Amplitude')
savefig('test.png')
I get the attached png without the extra border you describe.
Ryan
On 4/6/06, Arne.Bittig <arne.bittig@...1074...> wrote:
Hi,
I am using matplotlib to draw graphs. When I try to save a picture
(using savefig; usually as png, but at some point I might need eps files
as well), the actual graph comprises less than the central 50% of the
image, the rest of the image is wasted space.
I already tried figure(frameon = False, facecolor = 'w') and box(False)
to get rid of the redundant frame, but apparently it did not help (apart
from removing the black frame, obviously, but what I want is to save
only what is inside this frame).
Any ideas how to do this? If not, does anyone know a python tool that
handles pngs and would enable me to crop the picture in a second step?
Arne
-------------------------------------------------------
This SF.Net email is sponsored by xPML, a groundbreaking scripting language
that extends applications into web and mobile media. Attend the live webcast
and join the prime developer group breaking into this new coding territory!
http://sel.as-us.falkag.net/sel?cmd=lnk&kid=110944&bid=241720&dat=121642
_______________________________________________
Matplotlib-users mailing list
Matplotlib-users@lists.sourceforge.net
matplotlib-users List Signup and Options
------------------------------------------------------------------------
Arne,
I don't know about the "real" solution to this problem, but if you
want to go the route of "artificially" solving it with an image
library for post processing, you can check out Python Imaging Library:
http://www.pythonware.com/products/pil/
Mike
···
On Thu, Apr 06, 2006 at 02:36:55PM +0200, Arne.Bittig wrote:
Sorry, maybe I didn't make that clear enough.
I was talking about a graph as in "graph theory". Since there is no
meaningful way to label the axes, and, in fact, no reason to show them
at all, the white space I was talking about is just where in your
picture there are the labels. So, looking at your example, what I'd like
to have is what's inside the black rectangle, i.e. a png where the blue
curve touches the top and the bottom of the image.
Arne
Ryan Krauss wrote:
>I don't think this is the default behavior. If I do
>
>t=arange(0,1,0.01)
>y=sin(2*pi*t)
>plot(t,y)
>xlabel('Time (sec)')
>ylabel('Amplitude')
>savefig('test.png')
>
>I get the attached png without the extra border you describe.
>
>Ryan
>
>
>On 4/6/06, Arne.Bittig <arne.bittig@...1074...> wrote:
>
>>Hi,
>>
>>I am using matplotlib to draw graphs. When I try to save a picture
>>(using savefig; usually as png, but at some point I might need eps files
>>as well), the actual graph comprises less than the central 50% of the
>>image, the rest of the image is wasted space.
>>
>>I already tried figure(frameon = False, facecolor = 'w') and box(False)
>>to get rid of the redundant frame, but apparently it did not help (apart
>>from removing the black frame, obviously, but what I want is to save
>>only what is inside this frame).
>>
>>Any ideas how to do this? If not, does anyone know a python tool that
>>handles pngs and would enable me to crop the picture in a second step?
>>
>>Arne
>>
>>
>>-------------------------------------------------------
>>This SF.Net email is sponsored by xPML, a groundbreaking scripting
>>language
>>that extends applications into web and mobile media. Attend the live
>>webcast
>>and join the prime developer group breaking into this new coding
>>territory!
>>http://sel.as-us.falkag.net/sel?cmd=lnk&kid=110944&bid=241720&dat=121642
>>_______________________________________________
>>Matplotlib-users mailing list
>>Matplotlib-users@lists.sourceforge.net
>>matplotlib-users List Signup and Options
>
>>
>
>
>------------------------------------------------------------------------
>
-------------------------------------------------------
This SF.Net email is sponsored by xPML, a groundbreaking scripting
language
that extends applications into web and mobile media. Attend the live
webcast
and join the prime developer group breaking into this new coding
territory!
http://sel.as-us.falkag.net/sel?cmd=lnk&kid=110944&bid=241720&dat=121642
_______________________________________________
Matplotlib-users mailing list
Matplotlib-users@lists.sourceforge.net
matplotlib-users List Signup and Options
I think what you want to do is create your axes so they span the entire
figure:
axes([0,0,1,1])
···
On Thursday 06 April 2006 08:36, Arne.Bittig wrote:
Sorry, maybe I didn't make that clear enough.
I was talking about a graph as in "graph theory". Since there is no
meaningful way to label the axes, and, in fact, no reason to show them
at all, the white space I was talking about is just where in your
picture there are the labels. So, looking at your example, what I'd like
to have is what's inside the black rectangle, i.e. a png where the blue
curve touches the top and the bottom of the image.
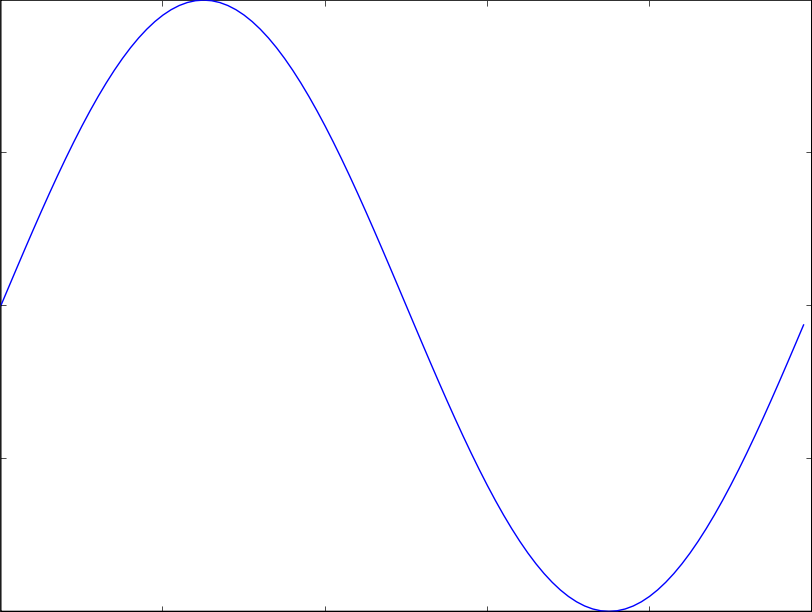
Not a problem. Go into your matplotlibrc file and change these lines:
# The figure subplot parameters. All dimensions are fraction of the
# figure width or height
figure.subplot.left : 0.001 # the left side of the subplots of the figure
figure.subplot.right : 0.999 # the right side of the subplots of the figure
figure.subplot.bottom : 0.001 # the bottom of the subplots of the figure
figure.subplot.top : 0.999
figure.subplot.wspace : 0.001 # the amount of width reserved for
blank space between subplots
figure.subplot.hspace : 0.001 # the amount of height reserved for
white space between subplots
They control the white space around the frame where the axes go. With
the above values, I created the attached plot which I think is close
to what you want.
Ryan
···
On 4/6/06, Michael V. De Palatis <mdepalatis@...1075...> wrote:
Arne,
I don't know about the "real" solution to this problem, but if you
want to go the route of "artificially" solving it with an image
library for post processing, you can check out Python Imaging Library:
http://www.pythonware.com/products/pil/
Mike
On Thu, Apr 06, 2006 at 02:36:55PM +0200, Arne.Bittig wrote:
> Sorry, maybe I didn't make that clear enough.
>
> I was talking about a graph as in "graph theory". Since there is no
> meaningful way to label the axes, and, in fact, no reason to show them
> at all, the white space I was talking about is just where in your
> picture there are the labels. So, looking at your example, what I'd like
> to have is what's inside the black rectangle, i.e. a png where the blue
> curve touches the top and the bottom of the image.
>
> Arne
>
> Ryan Krauss wrote:
>
> >I don't think this is the default behavior. If I do
> >
> >t=arange(0,1,0.01)
> >y=sin(2*pi*t)
> >plot(t,y)
> >xlabel('Time (sec)')
> >ylabel('Amplitude')
> >savefig('test.png')
> >
> >I get the attached png without the extra border you describe.
> >
> >Ryan
> >
> >
> >On 4/6/06, Arne.Bittig <arne.bittig@...1074...> wrote:
> >
> >>Hi,
> >>
> >>I am using matplotlib to draw graphs. When I try to save a picture
> >>(using savefig; usually as png, but at some point I might need eps files
> >>as well), the actual graph comprises less than the central 50% of the
> >>image, the rest of the image is wasted space.
> >>
> >>I already tried figure(frameon = False, facecolor = 'w') and box(False)
> >>to get rid of the redundant frame, but apparently it did not help (apart
> >>from removing the black frame, obviously, but what I want is to save
> >>only what is inside this frame).
> >>
> >>Any ideas how to do this? If not, does anyone know a python tool that
> >>handles pngs and would enable me to crop the picture in a second step?
> >>
> >>Arne
> >>
> >>
> >>-------------------------------------------------------
> >>This SF.Net email is sponsored by xPML, a groundbreaking scripting
> >>language
> >>that extends applications into web and mobile media. Attend the live
> >>webcast
> >>and join the prime developer group breaking into this new coding
> >>territory!
> >>http://sel.as-us.falkag.net/sel?cmd=lnk&kid=110944&bid=241720&dat=121642
> >>_______________________________________________
> >>Matplotlib-users mailing list
> >>Matplotlib-users@lists.sourceforge.net
> >>matplotlib-users List Signup and Options
> >
> >>
> >
> >
> >------------------------------------------------------------------------
> >
>
>
>
> -------------------------------------------------------
> This SF.Net email is sponsored by xPML, a groundbreaking scripting
> language
> that extends applications into web and mobile media. Attend the live
> webcast
> and join the prime developer group breaking into this new coding
> territory!
> http://sel.as-us.falkag.net/sel?cmd=lnk&kid=110944&bid=241720&dat=121642
> _______________________________________________
> Matplotlib-users mailing list
> Matplotlib-users@lists.sourceforge.net
> matplotlib-users List Signup and Options
-------------------------------------------------------
This SF.Net email is sponsored by xPML, a groundbreaking scripting language
that extends applications into web and mobile media. Attend the live webcast
and join the prime developer group breaking into this new coding territory!
http://sel.as-us.falkag.net/sel?cmd=lnk&kid=110944&bid=241720&dat=121642
_______________________________________________
Matplotlib-users mailing list
Matplotlib-users@lists.sourceforge.net
matplotlib-users List Signup and Options
My solution and Darren's do nearly the same thing.
···
On 4/6/06, Ryan Krauss <ryanlists@...287...> wrote:
Not a problem. Go into your matplotlibrc file and change these lines:
# The figure subplot parameters. All dimensions are fraction of the
# figure width or height
figure.subplot.left : 0.001 # the left side of the subplots of the figure
figure.subplot.right : 0.999 # the right side of the subplots of the figure
figure.subplot.bottom : 0.001 # the bottom of the subplots of the figure
figure.subplot.top : 0.999
figure.subplot.wspace : 0.001 # the amount of width reserved for
blank space between subplots
figure.subplot.hspace : 0.001 # the amount of height reserved for
white space between subplots
They control the white space around the frame where the axes go. With
the above values, I created the attached plot which I think is close
to what you want.
Ryan
On 4/6/06, Michael V. De Palatis <mdepalatis@...1075...> wrote:
> Arne,
>
> I don't know about the "real" solution to this problem, but if you
> want to go the route of "artificially" solving it with an image
> library for post processing, you can check out Python Imaging Library:
>
> http://www.pythonware.com/products/pil/
>
> Mike
>
> On Thu, Apr 06, 2006 at 02:36:55PM +0200, Arne.Bittig wrote:
> > Sorry, maybe I didn't make that clear enough.
> >
> > I was talking about a graph as in "graph theory". Since there is no
> > meaningful way to label the axes, and, in fact, no reason to show them
> > at all, the white space I was talking about is just where in your
> > picture there are the labels. So, looking at your example, what I'd like
> > to have is what's inside the black rectangle, i.e. a png where the blue
> > curve touches the top and the bottom of the image.
> >
> > Arne
> >
> > Ryan Krauss wrote:
> >
> > >I don't think this is the default behavior. If I do
> > >
> > >t=arange(0,1,0.01)
> > >y=sin(2*pi*t)
> > >plot(t,y)
> > >xlabel('Time (sec)')
> > >ylabel('Amplitude')
> > >savefig('test.png')
> > >
> > >I get the attached png without the extra border you describe.
> > >
> > >Ryan
> > >
> > >
> > >On 4/6/06, Arne.Bittig <arne.bittig@...1074...> wrote:
> > >
> > >>Hi,
> > >>
> > >>I am using matplotlib to draw graphs. When I try to save a picture
> > >>(using savefig; usually as png, but at some point I might need eps files
> > >>as well), the actual graph comprises less than the central 50% of the
> > >>image, the rest of the image is wasted space.
> > >>
> > >>I already tried figure(frameon = False, facecolor = 'w') and box(False)
> > >>to get rid of the redundant frame, but apparently it did not help (apart
> > >>from removing the black frame, obviously, but what I want is to save
> > >>only what is inside this frame).
> > >>
> > >>Any ideas how to do this? If not, does anyone know a python tool that
> > >>handles pngs and would enable me to crop the picture in a second step?
> > >>
> > >>Arne
> > >>
> > >>
> > >>-------------------------------------------------------
> > >>This SF.Net email is sponsored by xPML, a groundbreaking scripting
> > >>language
> > >>that extends applications into web and mobile media. Attend the live
> > >>webcast
> > >>and join the prime developer group breaking into this new coding
> > >>territory!
> > >>http://sel.as-us.falkag.net/sel?cmd=lnk&kid=110944&bid=241720&dat=121642
> > >>_______________________________________________
> > >>Matplotlib-users mailing list
> > >>Matplotlib-users@lists.sourceforge.net
> > >>matplotlib-users List Signup and Options
> > >
> > >>
> > >
> > >
> > >------------------------------------------------------------------------
> > >
> >
> >
> >
> > -------------------------------------------------------
> > This SF.Net email is sponsored by xPML, a groundbreaking scripting
> > language
> > that extends applications into web and mobile media. Attend the live
> > webcast
> > and join the prime developer group breaking into this new coding
> > territory!
> > http://sel.as-us.falkag.net/sel?cmd=lnk&kid=110944&bid=241720&dat=121642
> > _______________________________________________
> > Matplotlib-users mailing list
> > Matplotlib-users@lists.sourceforge.net
> > matplotlib-users List Signup and Options
>
>
> -------------------------------------------------------
> This SF.Net email is sponsored by xPML, a groundbreaking scripting language
> that extends applications into web and mobile media. Attend the live webcast
> and join the prime developer group breaking into this new coding territory!
> http://sel.as-us.falkag.net/sel?cmd=lnk&kid=110944&bid=241720&dat=121642
> _______________________________________________
> Matplotlib-users mailing list
> Matplotlib-users@lists.sourceforge.net
> matplotlib-users List Signup and Options
>
Yes, that is indeed what I was looking for - and it's significantly easier than I expected.
Thanks everybody.
Arne
Ryan Krauss wrote:
···
My solution and Darren's do nearly the same thing.
On 4/6/06, Ryan Krauss <ryanlists@...287...> wrote:
Not a problem. Go into your matplotlibrc file and change these lines:
# The figure subplot parameters. All dimensions are fraction of the
# figure width or height
figure.subplot.left : 0.001 # the left side of the subplots of the figure
figure.subplot.right : 0.999 # the right side of the subplots of the figure
figure.subplot.bottom : 0.001 # the bottom of the subplots of the figure
figure.subplot.top : 0.999
figure.subplot.wspace : 0.001 # the amount of width reserved for
blank space between subplots
figure.subplot.hspace : 0.001 # the amount of height reserved for
white space between subplots
They control the white space around the frame where the axes go. With
the above values, I created the attached plot which I think is close
to what you want.
Ryan
On 4/6/06, Michael V. De Palatis <mdepalatis@...1075...> wrote:
Arne,
I don't know about the "real" solution to this problem, but if you
want to go the route of "artificially" solving it with an image
library for post processing, you can check out Python Imaging Library:
http://www.pythonware.com/products/pil/
Mike
On Thu, Apr 06, 2006 at 02:36:55PM +0200, Arne.Bittig wrote:
Sorry, maybe I didn't make that clear enough.
I was talking about a graph as in "graph theory". Since there is no
meaningful way to label the axes, and, in fact, no reason to show them
at all, the white space I was talking about is just where in your
picture there are the labels. So, looking at your example, what I'd like
to have is what's inside the black rectangle, i.e. a png where the blue
curve touches the top and the bottom of the image.
Arne
Ryan Krauss wrote:
I don't think this is the default behavior. If I do
t=arange(0,1,0.01)
y=sin(2*pi*t)
plot(t,y)
xlabel('Time (sec)')
ylabel('Amplitude')
savefig('test.png')
I get the attached png without the extra border you describe.
Ryan
On 4/6/06, Arne.Bittig <arne.bittig@...1074...> wrote:
Hi,
I am using matplotlib to draw graphs. When I try to save a picture
(using savefig; usually as png, but at some point I might need eps files
as well), the actual graph comprises less than the central 50% of the
image, the rest of the image is wasted space.
I already tried figure(frameon = False, facecolor = 'w') and box(False)
to get rid of the redundant frame, but apparently it did not help (apart
from removing the black frame, obviously, but what I want is to save
only what is inside this frame).
Any ideas how to do this? If not, does anyone know a python tool that
handles pngs and would enable me to crop the picture in a second step?
Arne
-------------------------------------------------------
This SF.Net email is sponsored by xPML, a groundbreaking scripting
language
that extends applications into web and mobile media. Attend the live
webcast
and join the prime developer group breaking into this new coding
territory!
http://sel.as-us.falkag.net/sel?cmd=lnk&kid=110944&bid=241720&dat=121642
_______________________________________________
Matplotlib-users mailing list
Matplotlib-users@lists.sourceforge.net
matplotlib-users List Signup and Options
------------------------------------------------------------------------
-------------------------------------------------------
This SF.Net email is sponsored by xPML, a groundbreaking scripting
language
that extends applications into web and mobile media. Attend the live
webcast
and join the prime developer group breaking into this new coding
territory!
http://sel.as-us.falkag.net/sel?cmd=lnk&kid=110944&bid=241720&dat=121642
_______________________________________________
Matplotlib-users mailing list
Matplotlib-users@lists.sourceforge.net
matplotlib-users List Signup and Options
-------------------------------------------------------
This SF.Net email is sponsored by xPML, a groundbreaking scripting language
that extends applications into web and mobile media. Attend the live webcast
and join the prime developer group breaking into this new coding territory!
http://sel.as-us.falkag.net/sel?cmd=lnk&kid=110944&bid=241720&dat=121642
_______________________________________________
Matplotlib-users mailing list
Matplotlib-users@lists.sourceforge.net
matplotlib-users List Signup and Options