Hey folks,
I'm trying to make some bar plots using AxesGrid and the set_xlabels method doesn't seem to notice that I'm passing a 'rotation' kwarg.
Here's a small script that showing that this doesn't work:
# ------------------------------------------
import matplotlib.pyplot as pl
from mpl_toolkits.axes_grid import AxesGrid
fig = pl.figure()
grid = AxesGrid(fig, 111, nrows_ncols=(1,1), axes_pad=0.12)
xlabs = ['paul', 'chris', 'patti']
for ax in grid:
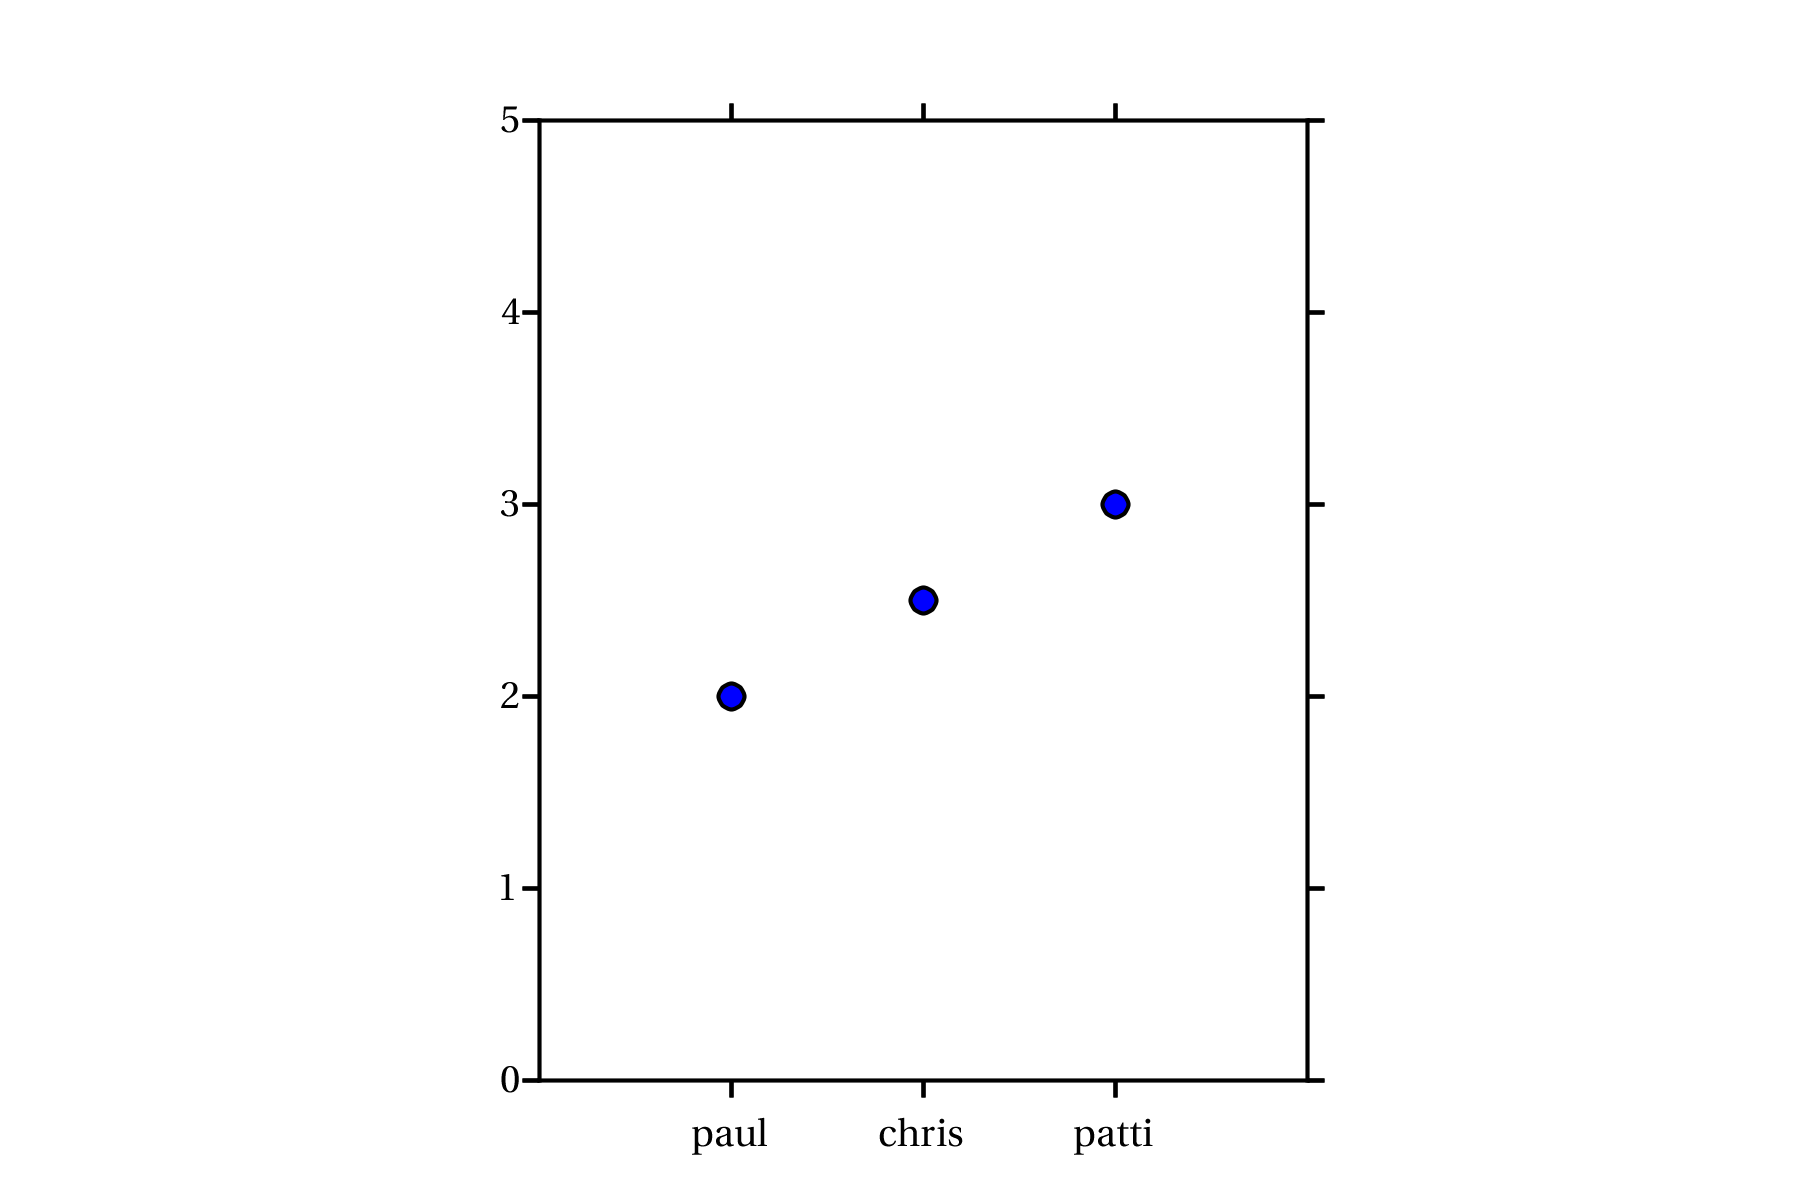
ax.plot([1,2,3], [2,2.5,3], 'bo')
ax.set_ylim([0,5])
ax.set_xlim([0,4])
ax.set_xticks([1,2,3])
ax.set_xticklabels(xlabs, rotation=90)
# -----------------------------------------
As you can see from the attached image, my labels aren't rotating. This is obviously a trivial example, but I'm trying to plot some chemical concentrations and the names are quite long.
Any tips? Should I just be using subpolot instead?
Python 2.6.2 and:
In [25]: import matplotlib as mpl
In [26]: mpl.__version__
Out[26]: '0.99.1'
In [27]: import numpy as np
In [28]: np.__version__
Out[28]: '1.3.0'
Thanks!
Paul M. Hobson
Senior Staff Engineer
···
--
Geosyntec Consultants
55 SW Yamhill St, Ste 200
Portland, OR 97204
Phone: (503) 222-9518
www.geosyntec.com