I don't know the prehistory of GraphicsContext in matplotlib, but IMHO, the issue here is that the matplotlib GraphicsContext class is just badly named. All it is is a class to store a bunch of graphics properties to be passed along to draw_path etc. to describe what is to be drawn. It doesn't infer any persistent state or stack-like activity, which is why the name "Context" is probably inappropriate.
The problem in the Cairo backend is that the setting of the Cairo clipping region was happening in the matplotlib GraphicsContext.set_clip_rectangle method -- when all it should have done was to store it there and use it later within draw_path. This is what all other backends do, even though many of them (PS, PDF for instance), have the same save/restore semantics as Cairo and OS-X.
While it may be easy to add stack semantics to backends that don't support them, it is nontrivial to rewrite large parts of the Artists layer to use stack semantics, which implies being more careful about nesting, and particularly about popping contexts away, which it currently doesn't do. At present, a new "GraphicsContext" is constructed from scratch for each element that is drawn, and they don't imply any sort of heirarchy. On some level, that might be considered sloppy, but on another level it's an example of "flat is better than nested" (see the Zen of Python). It may sometime seems cleaner/more efficient to have the heirarchy of objects reflected in a heirarchy of graphics contexts. This is often true of transformations, but the advantages break down when you consider non-linear transformations (since none of the backends support non-linear transformations). And I don't see any significant advantage to inheriting things like stroke and fill from the parent given the current architecture of matplotlib. So it would be a lot of work in the Artist layer for little gain there.
It's unfortunate that this clash of terminology lead to a misunderstanding about how to write a backend. That should definitely be documented, and perhaps the "GraphicsContextBase" class name should be changed. But I don't know that rewriting the Artists to use stack semantics is the best way out, or even desirable given infinite resources. I think the solution is to instead fix the backends to not rely on stack semantics and set the backend's context around each drawing operation, as the Agg, Ps, and Pdf backends do.
Michiel de Hoon wrote:
Recently I realized that there is a potential problem in both the Cairo and the Mac OS X backend related to how graphics contexts are handled. I tried your example and found that the Mac OS X backend shows the same incorrect result as the Cairo backend, which makes me suspect that this bug is related to the graphics context problem.
The problem is that matplotlib backends have a new_gc method, which is supposed to return a new graphics context. Unfortunately, Cairo and Quartz (used in the Mac OS X backend) do not have the capability to create a graphics context on the fly. Instead, Cairo and Quartz can save and restore graphics states on a stack. Both backends use a mock new_gc method by saving the graphics context on the stack, and trying to find that graphics context back in the stack when needed. This works most of the time, but it is fragile.
To give you another example where this breaks,
text(0, 0, 'my text', bbox=dict(facecolor='grey'),color='red')
shows the text in red with the tkagg backend, but in black with the Cairo and Mac OS X backends. The error occurs in the draw method in text.py:
gc = renderer.new_gc()
gc.set_foreground(self._color)
gc.set_alpha(self._alpha)
gc.set_url(self._url)
if self.get_clip_on():
gc.set_clip_rectangle(self.clipbox)
if self._bbox:
bbox_artist(self, renderer, self._bbox)
Inside bbox_artist, new_gc() is called again, which is OK on backends with a "true" new_gc, but will lose the information stored in the existing graphics context in backends with a mock new_gc.
This specific bug could perhaps be addressed by moving the bbox_artist call above the renderer.new_gc() call here -- but caring about this sort of order dependence worries me.
My guess is that in the bug you're seeing, the clipping path in one graphics context is overwritten by the clipping path in another graphics context. Maybe I'm wrong, but I hope that this gives you some idea of where to look.
It was actually that the clipping path was never cleared, and so we were getting the intersection of two clipping paths. This is the result of the artist layer not doing anything to pop (restore) contexts.
If this is indeed the problem, maybe it's a good idea for matplotlib to save and restore graphics contexts instead of using new_gc? It's easy to implement a save/restore mechanism in backends with a new_gc capability; the reverse is inherently fragile.
I agree. But that means changing the semantics of the entire program to fix a couple of differently-written backend interfaces. I'd rather just fix the backends.
All this is just me 2 cents. I certainly welcome contrary feedback if there's a real advantage to relying on stack-based semantics everywhere to justify the work required.
Cheers,
Mike
···
--Michiel
--- On Thu, 3/19/09, Nathaniel Smith <njs@...503...> wrote:
From: Nathaniel Smith <njs@...503...>
Subject: [matplotlib-devel] Rendering (clipping?) bug with Cairo backend
To: matplotlib-devel@lists.sourceforge.net
Date: Thursday, March 19, 2009, 7:13 AM
I ran into a very curious bug tonight, where if I
-- had multiple axes in a figure
-- and they had axison=False
-- and there was a patch or line in each axes
-- and there was an image in each axes
Then the image is not rendered (or, after some fiddling
with how the
subplots overlap, is sometimes partially rendered).
It took a few hours to isolate :-(.
I tried the GTKCairo and GTKAgg backends; the Cairo backend
shows the
bug, while the Agg backend renders it correctly.
This is with matplotlib 0.98.5.2, running on Linux x86-64.
Minimal code to reproduce the bug is:
--------
from matplotlib import patches, pyplot
def bug():
f = pyplot.figure()
a1 = f.add_axes([0, 0, 0.4, 0.9])
a2 = f.add_axes([0.5, 0, 0.4, 0.9])
a3 = f.add_axes([0.2, 0.2, 0.4, 0.9])
for a in [a1, a2, a3]:
# This shows up in axis 1, but not axis 2, and only
partially in axis 3:
a.imshow(np.arange(100).reshape(10, 10),
extent=(-1, 1, 1, -1))
# If you comment out either of these lines, then it
works properly:
a.axison = False
a.plot([0, 0], [1, 1])
pyplot.draw()
-------
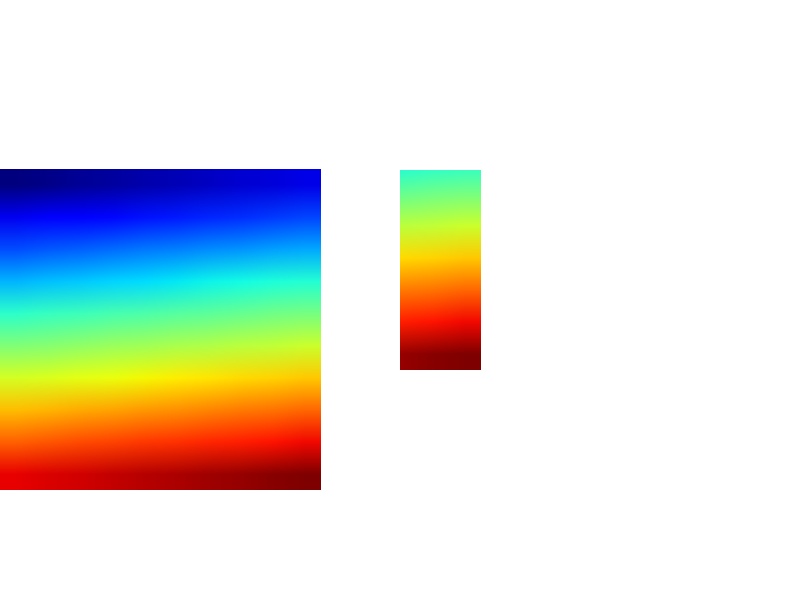
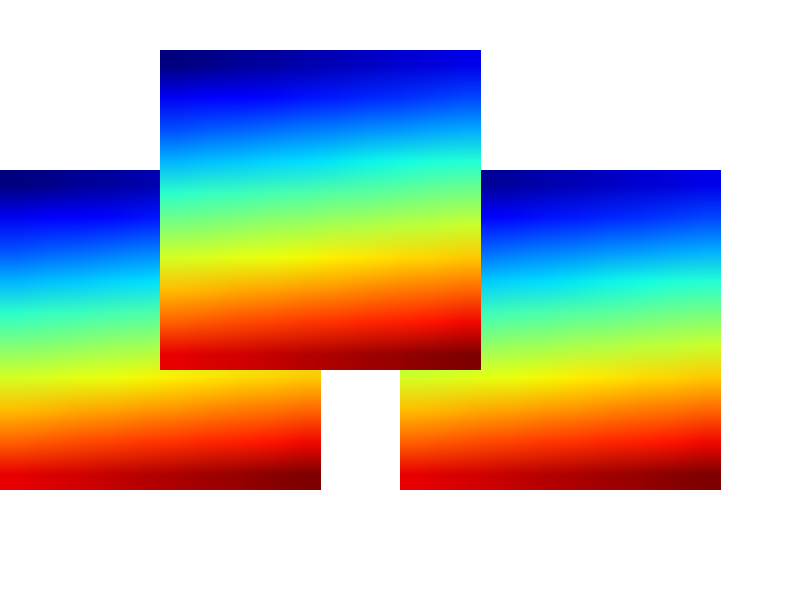
Renders with agg and cairo are attached for comparison.
Note that in
the cairo rendering, axes 1 is drawn correctly, axes 2 is
not drawn at
all, and the only part of axes 3 that is drawn is that part
that
overlaps axes 2.
-- Nathaniel
------------------------------------------------------------------------------
Apps built with the Adobe(R) Flex(R) framework and Flex
Builder(TM) are
powering Web 2.0 with engaging, cross-platform
capabilities. Quickly and
easily build your RIAs with Flex Builder, the
Eclipse(TM)based development
software that enables intelligent coding and step-through
debugging.
Download the free 60 day trial.
http://p.sf.net/sfu/www-adobe-com_______________________________________________
Matplotlib-devel mailing list
Matplotlib-devel@lists.sourceforge.net
matplotlib-devel List Signup and Options
------------------------------------------------------------------------------
Apps built with the Adobe(R) Flex(R) framework and Flex Builder(TM) are
powering Web 2.0 with engaging, cross-platform capabilities. Quickly and
easily build your RIAs with Flex Builder, the Eclipse(TM)based development
software that enables intelligent coding and step-through debugging.
Download the free 60 day trial. http://p.sf.net/sfu/www-adobe-com
_______________________________________________
Matplotlib-devel mailing list
Matplotlib-devel@lists.sourceforge.net
matplotlib-devel List Signup and Options
--
Michael Droettboom
Science Software Branch
Operations and Engineering Division
Space Telescope Science Institute
Operated by AURA for NASA