Hi,
I am creating a figure with multiple subplots. How can I remove the little strokes at each xtick and ytick?
I thought they were minorticks, so I used ax.minorticks_off() to delete them. However, it did not change the figure output.
Code for Reproduction:
%matplotlib inline
import matplotlib.pyplot as plt

plt.rcParams["font.size"] =  5
plt.rcParams["axes.spines.right"] = False
plt.rcParams["axes.spines.left"] = False
plt.rcParams["axes.spines.top"] = False
plt.rcParams["axes.spines.bottom"] = False

X = [x for x in range(2003, 2021)]
Y = [y for y in range(20, 38)]

cols = 2
rows = 2

fig, ax = plt.subplots(
    ncols=cols, nrows=rows, sharey=True, sharex=True
)


for col in range(cols):
    for row in range(rows):
        ax[col][row].minorticks_off()
        ax[col][row].bar(X, Y, color="gainsboro")
Output:
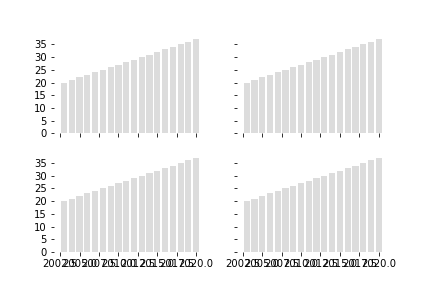
Thank you very much for your help!