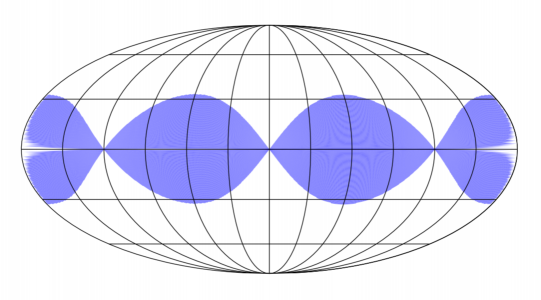
I'm plotting a coverage map of a sphere using the Mollweide plot in
basemap. The attachment is an example that is produced by sending an
array of polygons (one polygon per row described as four corners, one
per column) described using polar (theta) and azimuthal (phi) angles to
the following function. As a kludge, I discard any polygons that cross
the map boundary, but this produces artefacts and it would be better to
subdivide these and keep the parts. I was wondering whether there's a
function I missed that allows me to add polygons and performs the split
across the map boundary.
Gary R.
def Mollweide(theta, phi):
def combinations(iterable, r):
''' Python 2.6 itertools function'''
# combinations('ABCD', 2) --> AB AC AD BC BD CD
# combinations(range(4), 3) --> 012 013 023 123
pool = tuple(iterable)
n = len(pool)
if r > n:
return
indices = range(r)
yield tuple(pool[i] for i in indices)
while True:
for i in reversed(range(r)):
if indices[i] != i + n - r:
break
else:
return
indices[i] += 1
for j in range(i+1, r):
indices[j] = indices[j-1] + 1
yield tuple(pool[i] for i in indices)
def boundary_crossed(pts):
crossed = False
for c in combinations(pts, 2):
if abs(c[0]-c[1])>180:
crossed = True
break
return crossed
# Make Mollweide plot
m = Basemap(projection='moll', lon_0=0, resolution='c')
# draw the edge of the map projection region (the projection limb)
m.drawmapboundary()
# draw lat/lon grid lines every 30 degrees.
m.drawmeridians(np.arange(0,360,30), dashes=[10,0])
m.drawparallels(np.arange(-90,90,30), dashes=[10,0])
ax = plt.gca() # get current axes instance
for i in range(theta.shape[0]):
pts = np.vstack((theta[i], phi[i])).T
if boundary_crossed(pts[:,1]):
continue # skip polys that cross the map boundary
polypts = [m(pt[1], pt[0]) for pt in pts]
poly = Polygon(polypts, facecolor="b", edgecolor="None",
alpha=0.5)
ax.add_patch(poly)