I can get a graph drawn using the plot function. But I would like to highlight some “special” points by having the projections drawn on the axes and putting text on both the point and the axes.
Something like this:
https://static.oilproject.org/content/7078/crescente.png
I tried with this:
import matplotlib.pyplot as plt
[...]
plt.plot(X, Y, label='data') # draw curve, X and Y are arrays
plt.plot(Xp, Yp, c, duration), marker='o') # draw point @(Xp, Yp), Xp and Yp are scalars
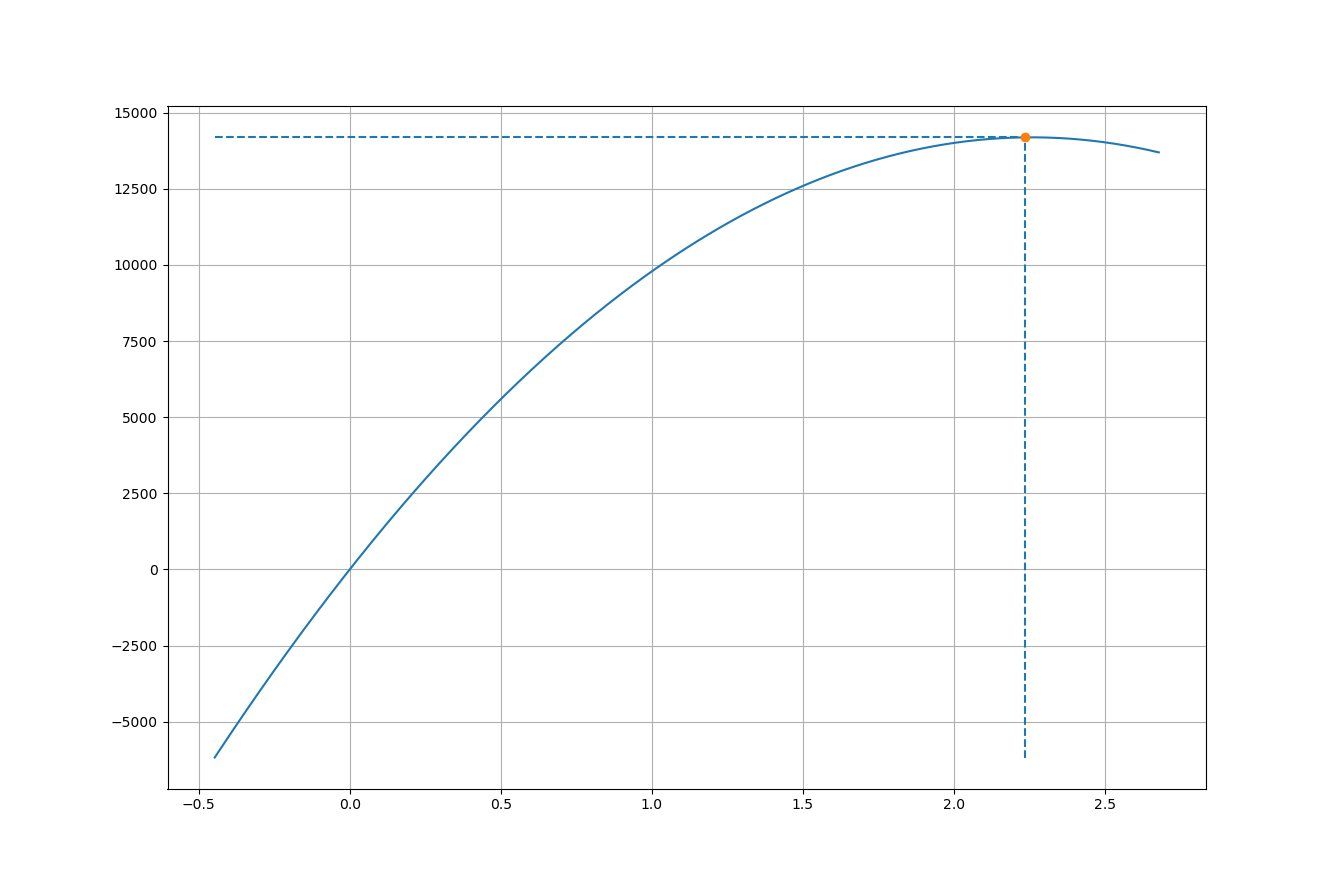
plt.vlines(Xp, min(Y), Yp, linestyles='dashed')
plt.hlines(Yp, min(X), Xp, linestyles='dashed')
plt.grid(True)
plt.show()
but what I get is not satisfactory:
What is the right way to get what I want?
I’ve also considered annotate, but it doesn’t seem to do what I need. Correct me if I’m wrong.
best regards
Max