Hi,
I'm having strange problems with contourf plots. The plotting routine is rather elaborate, so I don't have an easy way to reproduce the problem (unfortunately). The problem should be evident from the attachments. As you can see, the contourf routine doesn't color the whole plot area. Also, after some editing in Adobe Illustrator, it is also easy to see that some contours are drawn on top of others. This must surely be a bug?
I would like to note that this happened on the TkAgg (using show()), Agg (png format), ps (eps format), macosx (using show()) and pdf backends. Also, for some data sets, the plot turns out just fine - I get this problem only for some data sets. I have no idea how to debug this, so I'd appreciate any hints you might provide.
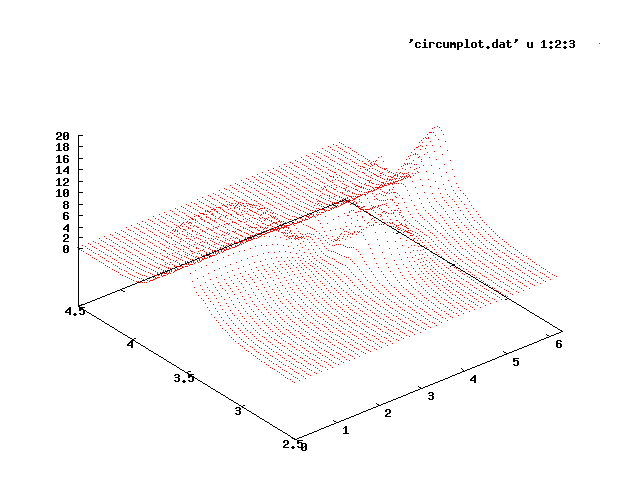
The file original.pdf shows the matplotlib result. The file edited.pdf shows that you have contours on top of each other. The file gnuplot.png gives an idea of what the end result should be: a lot of bumps around 3.5 eV, but some of this structure is missing from the contourf plots. The gnuplot plot was generated from the same data (ASCII text) file.
Best regards,
Paul.
original.pdf (79.3 KB)
edited.pdf (175 KB)
Paul Anton Letnes wrote:
Hi,
I'm having strange problems with contourf plots. The plotting routine is rather elaborate, so I don't have an easy way to reproduce the problem (unfortunately). The problem should be evident from the attachments. As you can see, the contourf routine doesn't color the whole plot area. Also, after some editing in Adobe Illustrator, it is also easy to see that some contours are drawn on top of others. This must surely be a bug?
Perhaps, but from what you provide we have no way of knowing whether the bug is in contourf or in your plotting routine. Can you make a simplest-possible script that reads in your data and contours it, and then provide that along with the data file?
Eric
···
I would like to note that this happened on the TkAgg (using show()), Agg (png format), ps (eps format), macosx (using show()) and pdf backends. Also, for some data sets, the plot turns out just fine - I get this problem only for some data sets. I have no idea how to debug this, so I'd appreciate any hints you might provide.
The file original.pdf shows the matplotlib result. The file edited.pdf shows that you have contours on top of each other. The file gnuplot.png gives an idea of what the end result should be: a lot of bumps around 3.5 eV, but some of this structure is missing from the contourf plots. The gnuplot plot was generated from the same data (ASCII text) file.
Best regards,
Paul.
------------------------------------------------------------------------
------------------------------------------------------------------------
------------------------------------------------------------------------------
------------------------------------------------------------------------
_______________________________________________
Matplotlib-users mailing list
Matplotlib-users@lists.sourceforge.net
matplotlib-users List Signup and Options
Paul Anton Letnes wrote:
Hi,
I'm having strange problems with contourf plots. The plotting routine is rather elaborate, so I don't have an easy way to reproduce the problem (unfortunately). The problem should be evident from the attachments. As you can see, the contourf routine doesn't color the whole plot area. Also, after some editing in Adobe Illustrator, it is also easy to see that some contours are drawn on top of others. This must surely be a bug?
It is in your data file and/or your handling of it, not in contourf. The problem is that your theta variable is not monotonic--it starts and ends with zero. If you chop off the last line of your data file, or equivalently chop off the last column of each array after you read it, like this:
return thetas[:,:-1], freqs[:,:-1], Es[:,:-1]
then the contouring works fine.
Eric
···
I would like to note that this happened on the TkAgg (using show()), Agg (png format), ps (eps format), macosx (using show()) and pdf backends. Also, for some data sets, the plot turns out just fine - I get this problem only for some data sets. I have no idea how to debug this, so I'd appreciate any hints you might provide.
The file original.pdf shows the matplotlib result. The file edited.pdf shows that you have contours on top of each other. The file gnuplot.png gives an idea of what the end result should be: a lot of bumps around 3.5 eV, but some of this structure is missing from the contourf plots. The gnuplot plot was generated from the same data (ASCII text) file.
Best regards,
Paul.
------------------------------------------------------------------------
------------------------------------------------------------------------
------------------------------------------------------------------------------
------------------------------------------------------------------------
_______________________________________________
Matplotlib-users mailing list
Matplotlib-users@lists.sourceforge.net
matplotlib-users List Signup and Options
Hi,
thanks a lot Eric! I'm sorry I bothered you with this.
There's obviously an error in how my data generating script works.
cheers,
Paul.
···
On 27. juli. 2009, at 21.48, Eric Firing wrote:
Paul Anton Letnes wrote:
Hi,
I'm having strange problems with contourf plots. The plotting routine is rather elaborate, so I don't have an easy way to reproduce the problem (unfortunately). The problem should be evident from the attachments. As you can see, the contourf routine doesn't color the whole plot area. Also, after some editing in Adobe Illustrator, it is also easy to see that some contours are drawn on top of others. This must surely be a bug?
It is in your data file and/or your handling of it, not in contourf. The problem is that your theta variable is not monotonic--it starts and ends with zero. If you chop off the last line of your data file, or equivalently chop off the last column of each array after you read it, like this:
return thetas[:,:-1], freqs[:,:-1], Es[:,:-1]
then the contouring works fine.
Eric
I would like to note that this happened on the TkAgg (using show()), Agg (png format), ps (eps format), macosx (using show()) and pdf backends. Also, for some data sets, the plot turns out just fine - I get this problem only for some data sets. I have no idea how to debug this, so I'd appreciate any hints you might provide.
The file original.pdf shows the matplotlib result. The file edited.pdf shows that you have contours on top of each other. The file gnuplot.png gives an idea of what the end result should be: a lot of bumps around 3.5 eV, but some of this structure is missing from the contourf plots. The gnuplot plot was generated from the same data (ASCII text) file.
Best regards,
Paul.
------------------------------------------------------------------------
------------------------------------------------------------------------------
------------------------------------------------------------------------
_______________________________________________
Matplotlib-users mailing list
Matplotlib-users@lists.sourceforge.net
matplotlib-users List Signup and Options