Problem with subplot / matplotlib.dates interaction

I’ve been plotting timeseries data using the matplotlib.dates module and have come across an issue when using it in conjunction with the subplot command.

For figures with greater than one subplot in a particular column, the time (or x) axis ticks and their labels are only printed on the final subplot that is plotted, and are missing on all other subplots in that column (see example code below). The only exception is when the time axis is identical for each plot in the column (you can test this by editing my example code at ###) - then all time axis ticks and their labels are displayed correctly.

Is this a bug in the subplot source code, or am I missing something?

from pylab import *
from matplotlib.dates import YEARLY,
DateFormatter, rrulewrapper, RRuleLocator, drange
import datetime

tick every 5th easter

rule = rrulewrapper(YEARLY, byeaster=1, interval=5)
loc = RRuleLocator(rule)
formatter = DateFormatter(’%m/%d/%y’)

data for subplot 1

date1 = datetime.date( 1952, 1, 1 )
date2 = datetime.date( 2004, 4, 12 )
delta = datetime.timedelta(days=100)

dates = drange(date1, date2, delta)
s = rand(len(dates)) # make up some random y values

plot subplot 1

ax1 = subplot(211)
plot_date(dates, s)
ax1.xaxis.set_major_locator(loc)
ax1.xaxis.set_major_formatter(formatter)
labels = ax1.get_xticklabels()
setp(labels, rotation=30, fontsize=10)

data for subplot 2

date1 = datetime.date( 2052, 1, 1 ) ###( 1952, 1, 1 )
date2 = datetime.date( 2104, 4, 12 ) ###( 2004, 4, 12 )

dates = drange(date1, date2, delta)
s = rand(len(dates)) # make up some random y values

plot

subplot 2 #
ax2 = subplot(212)
plot_date(dates, s)
ax2.xaxis.set_major_locator(loc)
ax2.xaxis.set_major_formatter(formatter)
labels = ax2.get_xticklabels()
setp(labels, rotation=30, fontsize=10)

show()
I've been plotting timeseries data using the matplotlib.dates module and
have come across an issue when using it in conjunction with the subplot
command.

For figures with greater than one subplot in a particular column, the
time (or x) axis ticks and their labels are only printed on the final
subplot that is plotted, and are missing on all other subplots in that
column (see example code below). The only exception is when the time
axis is identical for each plot in the column (you can test this by
editing my example code at ###) - then all time axis ticks and their
labels are displayed correctly.

Is this a bug in the subplot source code, or am I missing something?

You are missing something, but it is something that is quite non-intuitive and easy to miss: Locators can't be shared among axes. The set_major_locator() method assigns its axis to that Locator, overwriting any axis that was previously assigned.

The solution is to make a new Locator instance for each axis that needs one.

Eric

···

On 2012/08/14 3:15 PM, Damien Irving wrote:

from pylab import *
from matplotlib.dates import YEARLY, DateFormatter, rrulewrapper,
RRuleLocator, drange
import datetime

# tick every 5th easter #
rule = rrulewrapper(YEARLY, byeaster=1, interval=5)
loc = RRuleLocator(rule)
formatter = DateFormatter('%m/%d/%y')

# data for subplot 1 #
date1 = datetime.date( 1952, 1, 1 )
date2 = datetime.date( 2004, 4, 12 )
delta = datetime.timedelta(days=100)

dates = drange(date1, date2, delta)
s = rand(len(dates)) # make up some random y values

# plot subplot 1 #
ax1 = subplot(211)
plot_date(dates, s)
ax1.xaxis.set_major_locator(loc)
ax1.xaxis.set_major_formatter(formatter)
labels = ax1.get_xticklabels()
setp(labels, rotation=30, fontsize=10)

# data for subplot 2 #
date1 = datetime.date( 2052, 1, 1 ) ###( 1952, 1, 1 )
date2 = datetime.date( 2104, 4, 12 ) ###( 2004, 4, 12 )

dates = drange(date1, date2, delta)
s = rand(len(dates)) # make up some random y values

# plot subplot 2 #
ax2 = subplot(212)
plot_date(dates, s)
ax2.xaxis.set_major_locator(loc)
ax2.xaxis.set_major_formatter(formatter)
labels = ax2.get_xticklabels()
setp(labels, rotation=30, fontsize=10)

show()

------------------------------------------------------------------------------
Live Security Virtual Conference
Exclusive live event will cover all the ways today's security and
threat landscape has changed and how IT managers can respond. Discussions
will include endpoint security, mobile security and the latest in malware
threats. http://www.accelacomm.com/jaw/sfrnl04242012/114/50122263/

_______________________________________________
Matplotlib-users mailing list
Matplotlib-users@lists.sourceforge.net
matplotlib-users List Signup and Options

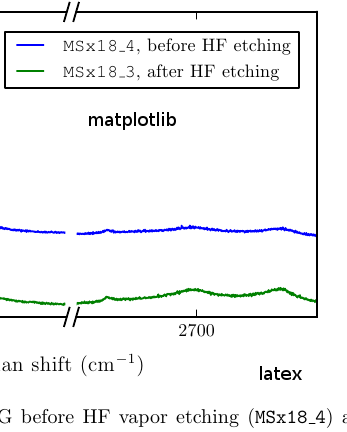
I get the attached result. The \texttt{} is rendered differently by
matplotlib and latex.

I am using the default latex fonts, and below is my preamble.

rc(‘font’, **{‘family’:‘serif’, ‘serif’:[‘Computer Modern Roman’]})

params = {'backend': 'pdf',

          'axes.labelsize': 12,

          'text.fontsize': 12,

          'legend.fontsize': 12,

          'xtick.labelsize': 10,

          'ytick.labelsize': 10,

          'text.usetex': True,

          'figure.figsize': fig_size,

          'axes.unicode_minus': True}

matplotlib.rcParams.update(params)

What do I have to change to match the font?

MPL_latex_fontdiff.png

Found the solution.
The default font of matplotlib is Courier, but LaTeX rendered with
Computer Modern Typewriter
Changing the first line makes matplotlib use the same font.

···

On 15/08/2012 09:56, Mogliii wrote:

  I get the attached result. The \texttt{} is rendered differently

by matplotlib and latex.

  I am using the default latex fonts, and below is my preamble.


  rc('font', **{'family':'serif', 'serif':['Computer Modern

Roman’]})

  params = {'backend': 'pdf',

            'axes.labelsize': 12,

            'text.fontsize': 12,

            'legend.fontsize': 12,

            'xtick.labelsize': 10,

            'ytick.labelsize': 10,

            'text.usetex': True,

            'figure.figsize': fig_size,

            'axes.unicode_minus': True}

  matplotlib.rcParams.update(params)


  What do I have to change to match the font?
rc('font', **{'family':'serif', 'serif':['Computer Modern Roman'],                                 'monospace': ['Computer Modern Typewriter']})