I have to plot some things that are the results of hyperbolic sines
and cosines. This leads to large amplitudes on the y-axis. I am
having trouble saving these plots to eps files. But I have done this
successfully before.
These lines
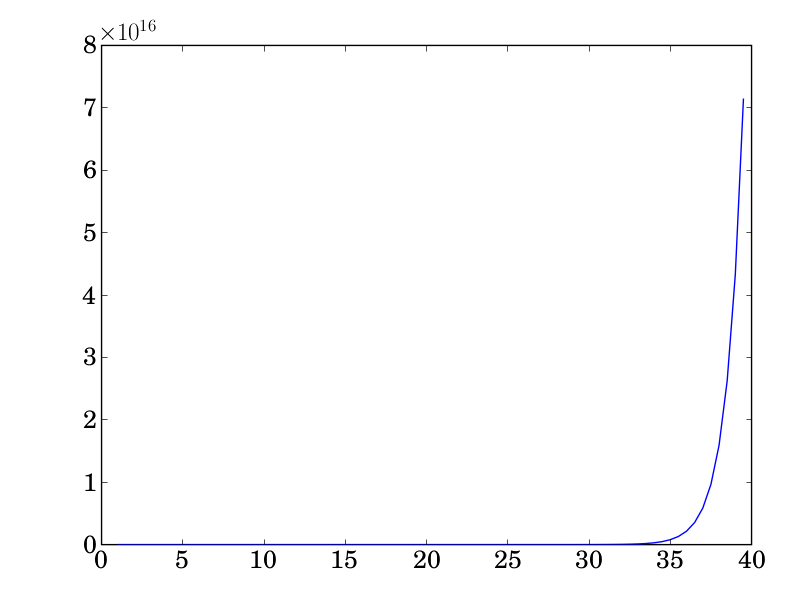
b=arange(1,40,0.5)
y=sinh(b)
figure(5)
plot(b,y)
savefig('test3.eps')
savefig('test3.png')
where the png is fine and the eps shows only an empty axis.
I have to get my thesis to my committee next week and I am freaking out a bit.
Please help me.
Thanks,
Ryan
test3.eps (35.4 KB)