Hello all,
I'm trying to show to a friend matplotlib features via pylab interface.
(thus to replace matlab/scilab)
I've a little problem while I'm trying to display plots into subplots here
under vista.
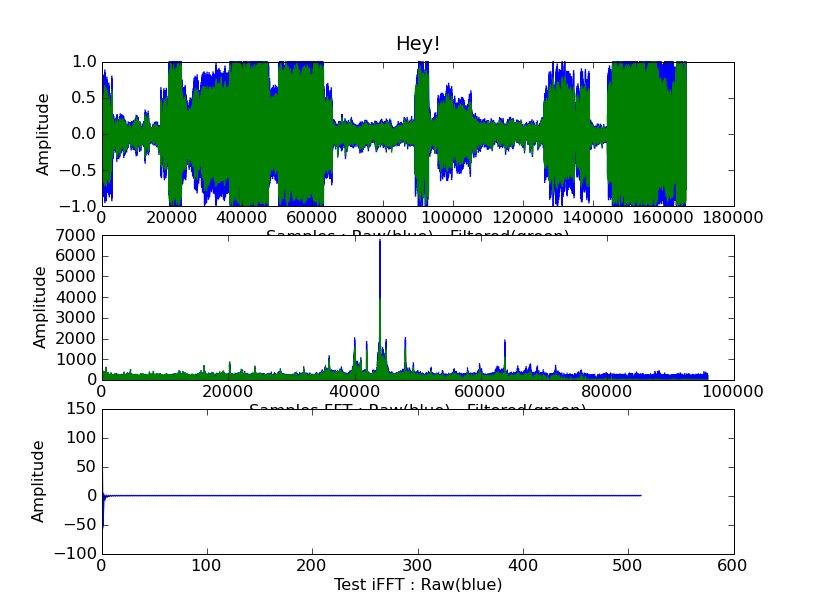
If I add a pylab.xlabel to the subplots they are masked by the underlying
subplot.
To workaround it I need to change the window size.
I used for myself add_axes([0.1,0.8,0.75,.15]) but that's not that easy.
Do I miss one important thing or must I go trought add_axes functions each
time I call pylab.subplot?
Thx for any idea!
Laurent
Hello all,
I'm trying to show to a friend matplotlib features via pylab interface.
(thus to replace matlab/scilab)
I've a little problem while I'm trying to display plots into subplots here
under vista.
If I add a pylab.xlabel to the subplots they are masked by the underlying
subplot.
To workaround it I need to change the window size.
I used for myself add_axes([0.1,0.8,0.75,.15]) but that's not that easy.
That's right (but sometimes I did the same 
Do I miss one important thing or must I go trought add_axes functions each
time I call pylab.subplot?
Yes, you can adjust the space between the subplot with
subplots_adjust()
Look at the docstring with
In [1]: subplots-adjust?
in ipython shell. Try to see the difference between
figure()
subplot(211)
subplot(212)
show()
and
figure()
subplots_adjust(hspace=0.4) # standard: 0.2
subplot(211)
subplot(212)
show()
By,
Friedrich
···
On Sat, Sep 20, 2008 at 04:06:36PM +0200, Laurent Dufrechou wrote:
Excellent!
That's was EXACTLY what I needed!
Thanks a lot Friedrich!
2008/9/20 Friedrich Hagedorn <friedrich_h@...380...>:
···
On Sat, Sep 20, 2008 at 04:06:36PM +0200, Laurent Dufrechou wrote:
Hello all,
I'm trying to show to a friend matplotlib features via pylab interface.
(thus to replace matlab/scilab)
I've a little problem while I'm trying to display plots into subplots here
under vista.
If I add a pylab.xlabel to the subplots they are masked by the underlying
subplot.
To workaround it I need to change the window size.
I used for myself add_axes([0.1,0.8,0.75,.15]) but that's not that easy.
That's right (but sometimes I did the same
Do I miss one important thing or must I go trought add_axes functions each
time I call pylab.subplot?
Yes, you can adjust the space between the subplot with
subplots_adjust()
Look at the docstring with
In [1]: subplots-adjust?
in ipython shell. Try to see the difference between
figure()
subplot(211)
subplot(212)
show()
and
figure()
subplots_adjust(hspace=0.4) # standard: 0.2
subplot(211)
subplot(212)
show()
By,
Friedrich