Dear all,
I have problems displaying plots for large datasets. Briefly, when attempting to plot a large number of data points these are not displayed, or only partially displayed. The simplest way for reproducing my problem is:
from pylab import *
datalen = 100000
data = rand(datalen)
plot(data)
show()
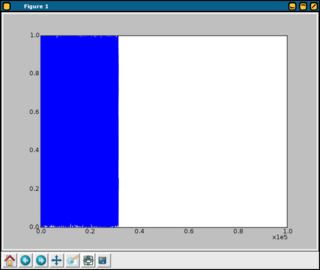
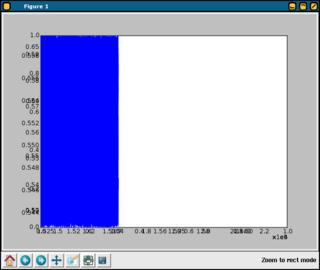
Here, if datalen is 10000, then the graph looks as expected. However, if datalen is increased, say, to 100000, then the resulting plot is incomplete (as shown in snapshot1). Moreover, when trying to zoom, the axes display the new values reflecting the zoomed scale, but the data are not actually zoomed (eg snapshot2). I have no clue as to what can be wrong, since no error is returned. Also, no error results from running the example above with --verbose-helpful:
antonio@...1054...:~/python> python test.py --verbose-helpful
matplotlib data path /usr/lib/python2.4/site-packages/matplotlib/mpl-data
$HOME=/home/antonio
CONFIGDIR=/home/antonio/.matplotlib
loaded rc file /home/antonio/.matplotlib/matplotlibrc
matplotlib version 0.88svn
verbose.level helpful
interactive is False
platform is linux2
numerix numpy 0.9.6.2206
font search path ['/usr/lib/python2.4/site-packages/matplotlib/mpl-data']
loaded ttfcache file /home/antonio/.matplotlib/ttffont.cache
backend TkAgg version 8.4
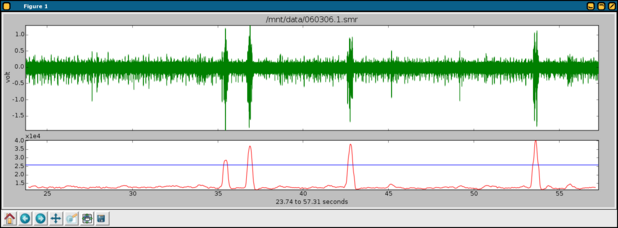
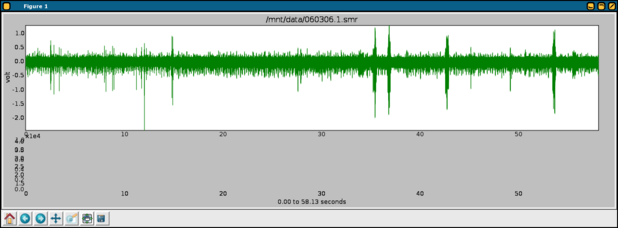
In a real example of what I'm trying to do: I read a fragment of data from a large file, then plot such fragment of data; convolve it and plot the result (as in snapshot3); interactively make some decisions according to such plot, and then move to the next fragment of my large file to repeat the process. However, whenever I attempt to plot large chunks of data, the plot is not displayed (eg snapshot4). As mentioned, no error is returned, and thus I have no clue as to how to fix this problem.
(For the record, in snapshot3 the length of data plotted is 671334 [top] and 132829 [bottom]. In snapshot4 it is 1162554 [top] and 231073 [bottom].)
Any help will be much appreciated.
Antonio
···
--
Antonio Gonzalez, MD MSc PhD
Department of Neuroscience
Karolinska Institutet
Retzius väg. 8
171 77 Stockholm
Sweden