Hello,
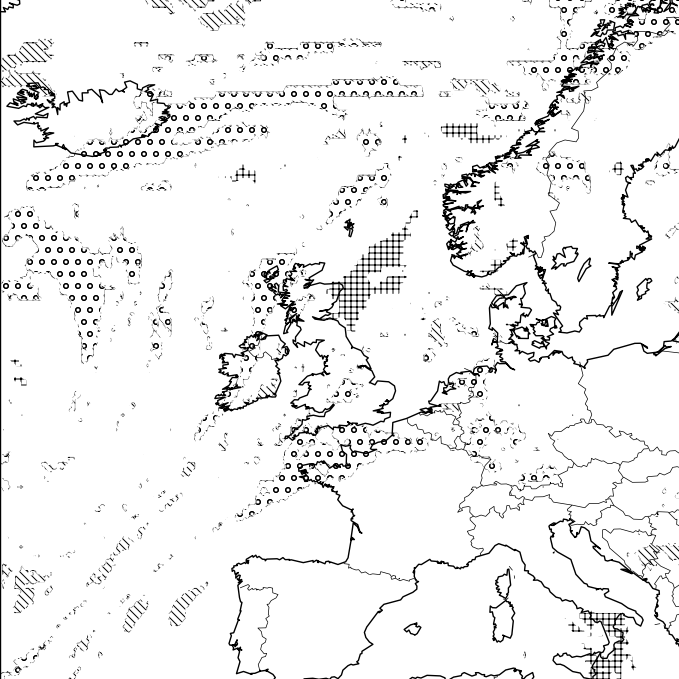
I am plotting grib data on maps with matplotlib. I want to plot some types
of hatches using a discrete values variable where the values are chosen
arbitrarily. For example the 'o' hatch refers to value '6', '\' hatch to
'4' and '+' to '2'. Values in matrix are only 2,4,6 and a background value
(example 0). I obtain what I want easly with contourf, but as you can see
in the attached image there are unwanted and ugly border plotted around
some hatches (those with the higher values, contoured by hatch of previous
lower value, except the first one wich is the '+' hatch). I tried every
combination of functions possible or modfication of values in the data
matrix to avoid those contours, but I did not find any solution. The fact
is that it seems to be dependent on the type of grib/matrix I use, since
with another set of grib of another model this problem does not show. So
any of you have encountered this problem and resolved it in a easy and
computationally low cost way?
By the way, the same problem is present in classic contourf with shaded
colors: with a discrete matrix, except the first one, each color in the
colorbar is contoured with a contour of the previous color in the chosen
colormap order. But I could overcome this problem using pcolormesh function
even if it is not the best solution. Unfortunately pcolormesh does not plot
hatches so the first problem described before actually is unresolved.I am
using python 3.5.1 with matplotlib 1.5.1
Waiting for any feedabck
Best regards
Cristian Rendina
-------------- next part --------------
An HTML attachment was scrubbed...
URL: <http://mail.python.org/pipermail/matplotlib-users/attachments/20160831/6a362cac/attachment-0001.html>
-------------- next part --------------
A non-text attachment was scrubbed...
Name: plot.png
Type: image/png
Size: 182782 bytes
Desc: not available
URL: <http://mail.python.org/pipermail/matplotlib-users/attachments/20160831/6a362cac/attachment-0001.png>