Dear All,
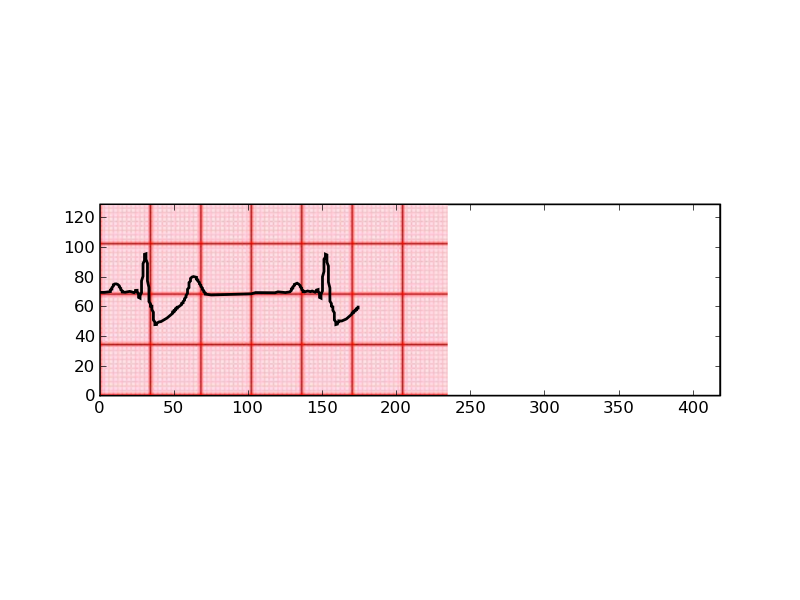
Currently I’m facing one problem. I have image of 230X135 as attched in this mail. I have dataset of 700 samples . and i want to plot this data on that image. But only 235 points are plotted properly and other points are plotted outside the image. If I scale xaxis that while plotting (x/4(or 5),y)
it plots all data but curve on the image is deformed.
Code is as following
from numpy import *
from scipy import *
from scipy import signal, misc
import sys,time,os,gc
import matplotlib
import matplotlib.pyplot as plt
from numpy.random import *
from pylab import plot, show, ylim, yticks,xlim
from pylab import *
#import matplotlib.pyplot as pyplot#xlim(0,4100)
import matplotlib as mpl
x=loadtxt(’/home/jaguar/Desktop/85.txt’)
#x=loadtxt(’/home/jaguar/Downloads/l2.txt’)
x=x[0:700]
y=arange(700)
#y=y[0:1398]
img=imread(’/home/jaguar/Downloads/a3.png’)
print len(y),len(x)
im = imshow(img, cmap=cm.hsv, origin=‘centre’)#, extent=extent)
plot(y/4,(x*30)+68,‘k’,linewidth=2,linestyle=’-’)
xlim(0,418)
ylim(0,129)
‘’‘frame1 = gca()
frame1.axes.get_xaxis().set_visible(False)
frame1.axes.get_yaxis().set_visible(False)’’’
‘’’%%%%%%%%%%%%%%%%%%%%%%%%%%%%%%%%%%%%%%%%%%%%%%%%%%%%%%%%%%%%%%’’’
savefig(’/home/jaguar/Softwares/Development/Python/bunty.pdf’)
savefig(’/home/jaguar/Softwares/Development/Python/deformed.png’)
plt.figure(2)
plt.plot(y,x,‘k-’)
plt.plot(y,0.00065*ones(len(x)),‘k-’)
#minorticks_on()
grid(True)#, color=“r”, ls="-")
gca().xaxis.grid(True, which=“minor”, color=“r”)
show()#lt.ylabel(‘ECG’)
Thanks in advance!!!
Regards
Yogesh
85.txt (37 KB)

Sorry if this mail is resent again!!!
85.txt (37 KB)
···
---------- Forwarded message ----------
From: yogesh karpate <yogeshkarpate@…287…>
Date: Wed, Mar 31, 2010 at 2:38 PM
Subject: Problem in background image and curve plotted in it
To: matplotlib-users@lists.sourceforge.net
Dear All,
Currently I'm facing one problem. I have image of 230X135 as attched in this mail. I have dataset of 700 samples . and i want to plot this data on that image. But only 235 points are plotted properly and other points are plotted outside the image. If I scale xaxis that while plotting (x/4(or 5),y)
it plots all data but curve on the image is deformed.
Code is as following
from numpy import *
from scipy import *
from scipy import signal, misc
import sys,time,os,gc
import matplotlib
import matplotlib.pyplot as plt
from numpy.random import *
from pylab import plot, show, ylim, yticks,xlim
from pylab import *
#import matplotlib.pyplot as pyplot#xlim(0,4100)
import matplotlib as mpl
x=loadtxt(’/home/jaguar/Desktop/85.txt’)
#x=loadtxt(’/home/jaguar/Downloads/l2.txt’)
x=x[0:700]
y=arange(700)
#y=y[0:1398]
img=imread(’/home/jaguar/Downloads/a3.png’)
print len(y),len(x)
im = imshow(img, cmap=cm.hsv, origin=‘centre’)#, extent=extent)
plot(y/4,(x*30)+68,‘k’,linewidth=2,linestyle=’-’)
xlim(0,418)
ylim(0,129)
‘’‘frame1 = gca()
frame1.axes.get_xaxis().set_visible(False)
frame1.axes.get_yaxis().set_visible(False)’’’
‘’’%%%%%%%%%%%%%%%%%%%%%%%%%%%%%%%%%%%%%%%%%%%%%%%%%%%%%%%%%%%%%%’’’
savefig(’/home/jaguar/Softwares/Development/Python/bunty.pdf’)
savefig(’/home/jaguar/Softwares/Development/Python/deformed.png’)
plt.figure(2)
plt.plot(y,x,‘k-’)
plt.plot(y,0.00065*ones(len(x)),‘k-’)
#minorticks_on()
grid(True)#, color=“r”, ls="-")
gca().xaxis.grid(True, which=“minor”, color=“r”)
show()#lt.ylabel(‘ECG’)
Thanks in advance!!!
Regards
Yogesh
Sorry if this mail is resent again!!!!!!
From: yogesh karpate <yogeshkarpate@...287...>
Date: Wed, Mar 31, 2010 at 2:38 PM
Subject: Problem in background image and curve plotted in it
To: matplotlib-users@lists.sourceforge.net
Dear All,
Currently I'm facing one problem. I have image of 230X135 as
attched in this mail. I have dataset of 700 samples . and i want to plot
this data on that image. But only 235 points are plotted properly and other
points are plotted outside the image. If I scale xaxis that while plotting
(x/4(or 5),y)
it plots all data but curve on the image is deformed.
Code is as following
[snip]
Thanks in advance!!!!!!!!
Regards
Yogesh
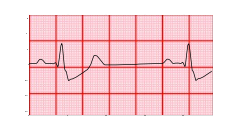
Hi Yogesh,
attached you find a minimal example of what I think you want to do and the
resulting image.
Kind regards,
Matthias
PS: You should try to simplify and shorten your code as far as possible,
because typically people don't want to spend a lot of time to go through your
script. A small stand-alone example, which illustrates the problem is a good
starting point for others.
background_image.py (625 Bytes)
···
On Wednesday 31 March 2010 11:11:58 yogesh karpate wrote:
---------- Forwarded message ----------