Hello John,
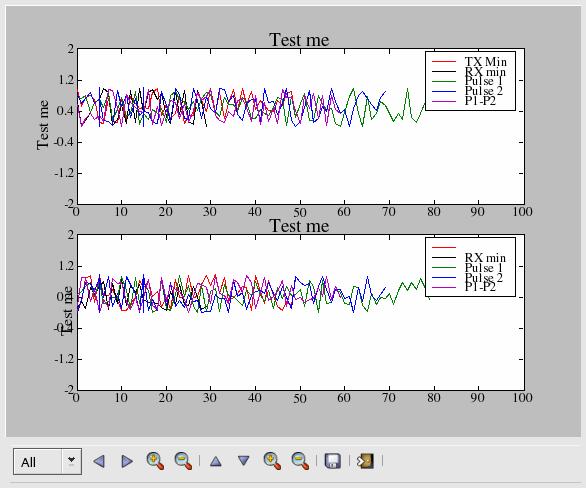
I have run into the following minor matplotlib bug. Using the sample code below, the y axis label and tick marks in the second subplot seem not to be in the right places. Also on that second subplot, the first legend is missing when the window is initially drawn, but gets redrawn correctly if I use the x axis interactive scrolling buttons.
Attached to this note is a snapshot of the figure window as initially drawn showing the bugs. (I don't know whether the mailing list deals with attachments correctly, so I'm mailing you a copy directly.)
The installation here is matplotlib version 0.50 running on a Redhat 9 linux box:
[pje@...105... site-packages]$ uname -a
Linux amon 2.4.20-6smp #1 SMP Thu Feb 27 09:59:40 EST 2003 i686 i686 i386 GNU/Linux
···
-----------------------------------------------------------------------
Code:
from matplotlib.matlab import *
figure(1)
subplot(211)
plot(rand(50),'r')
plot(rand(30),'k')
plot(rand(80),'g')
plot(rand(70),'b')
plot(rand(60),'m')
plot(5 * array([1,1]), get(gca(),'ylim'), 'b')
plot(15 * array([1,1]), get(gca(),'ylim'), 'b')
axis([0,100,-2,2])
ylabel('Test me')
title('Test me')
legend(['TX Min', 'RX min', 'Pulse 1', 'Pulse 2', 'P1-P2'])
subplot(212)
plot(rand(50),'r')
plot(rand(30),'k')
plot(rand(80),'g')
plot(rand(70),'b')
plot(rand(60),'m')
plot(5 * array([1,1]), get(gca(),'ylim'), 'b')
plot(15 * array([1,1]), get(gca(),'ylim'), 'b')
axis([0,100,-2,2])
ylabel('Test me')
title('Test me')
legend(['TX Min', 'RX min', 'Pulse 1', 'Pulse 2', 'P1-P2'])
show()
--
----
Phil Erickson email: pje@...101...
Atmospheric Sciences Group WWW: http://www.haystack.mit.edu
MIT Haystack Observatory voice: 781 981 5769
Westford, MA 01886 USA fax: 781 981 5766
Public key: http://pgp.mit.edu:11371/pks/lookup?op=get&search=0x54878872