Hi all,
The following code generates .png files fine ("python test.py") but
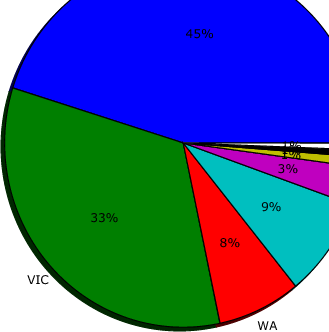
the postscript backend ("python test.py -dPS") clips the upper right,
as attached (converted to .png). Thoughts?
-Charles
import pylab
pylab.figure(1, figsize=(8,8))
#ax = pylab.axes([0.1, 0.1, 0.8, 0.8])
pop_fig = pylab.pie([150,110,25,29,11,3,2,2],
labels = ['NSW','VIC','WA','SA','QLD','ACT','NT','TAS'],
autopct = "%1.0f%%",
shadow=True)
pylab.title("Num Cases by State or Territory")
pylab.savefig('test')
···
--
Charles R. Twardy
Please include your version of matplotlib and any nonstandard rc settings,
otherwise I cant help.
Darren
···
On Wednesday 01 March 2006 13:51, Charles R. Twardy wrote:
Hi all,
The following code generates .png files fine ("python test.py") but
the postscript backend ("python test.py -dPS") clips the upper right,
as attached (converted to .png). Thoughts?
-Charles
import pylab
pylab.figure(1, figsize=(8,8))
#ax = pylab.axes([0.1, 0.1, 0.8, 0.8])
pop_fig = pylab.pie([150,110,25,29,11,3,2,2],
labels =
['NSW','VIC','WA','SA','QLD','ACT','NT','TAS'], autopct = "%1.0f%%",
shadow=True)
pylab.title("Num Cases by State or Territory")
pylab.savefig('test')
--
Charles R. Twardy
--
Darren S. Dale, Ph.D.
Cornell High Energy Synchrotron Source
Cornell University
200L Wilson Lab
Rt. 366 & Pine Tree Road
Ithaca, NY 14853
dd55@...163...
office: (607) 255-9894
fax: (607) 255-9001