2010/12/13 Will Grover <wgrover@...1166...>:
A belated thank you to Ben and Friedrich for your suggestions! I'm getting
good results shifting subplots around using Axes.set_position() as Friedrich
suggested, but I've noticed that whenever I shift a subplot into the region
where another subplot would be, the subplot I'm shifting just disappears.
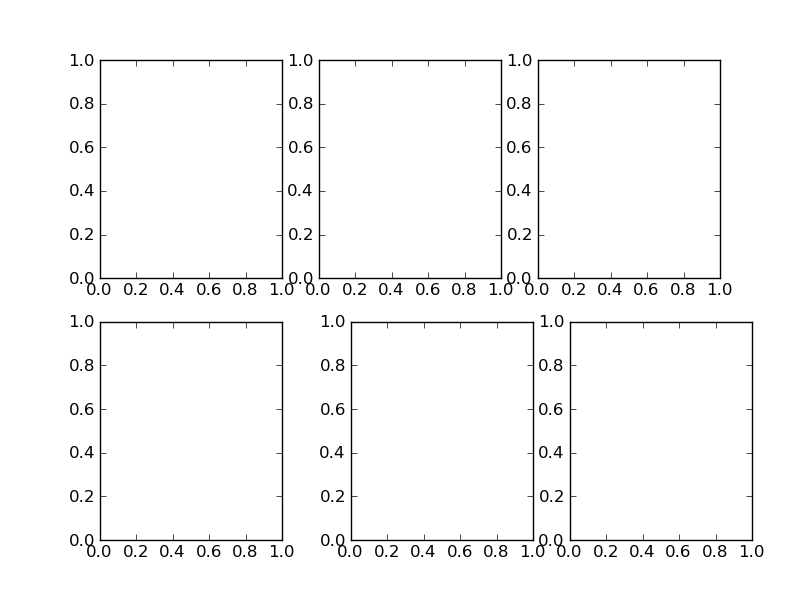
This code demonstrates this; it creates a figure of six subplots and
attempts to shift subplots 5 and 6 to the right:
import pylab
offset = 0.04 # works for 0.04, but subplot 5 disappears at >0.05
pylab.subplot(2,3,1)
pylab.subplot(2,3,2)
pylab.subplot(2,3,3)
pylab.subplot(2,3,4)
pylab.subplot(2,3,5)
bbox=pylab.gca().get_position()
pylab.gca().set_position([bbox.x0 + offset, bbox.y0, bbox.x1-bbox.x0,
bbox.y1-bbox.y0])
pylab.subplot(2,3,6)
bbox=pylab.gca().get_position()
pylab.gca().set_position([bbox.x0 + offset, bbox.y0, bbox.x1-bbox.x0,
bbox.y1-bbox.y0])
pylab.savefig("out.png")
Setting offset to 0.04 results in subplots 5 and 6 being shifted to the
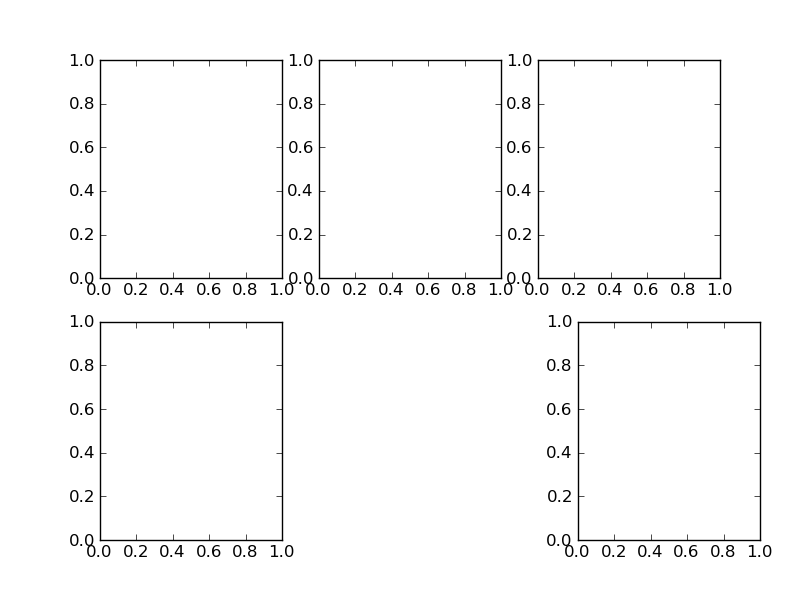
right a bit, as expected (see 0_04_offset.png), but if offset >= 0.05
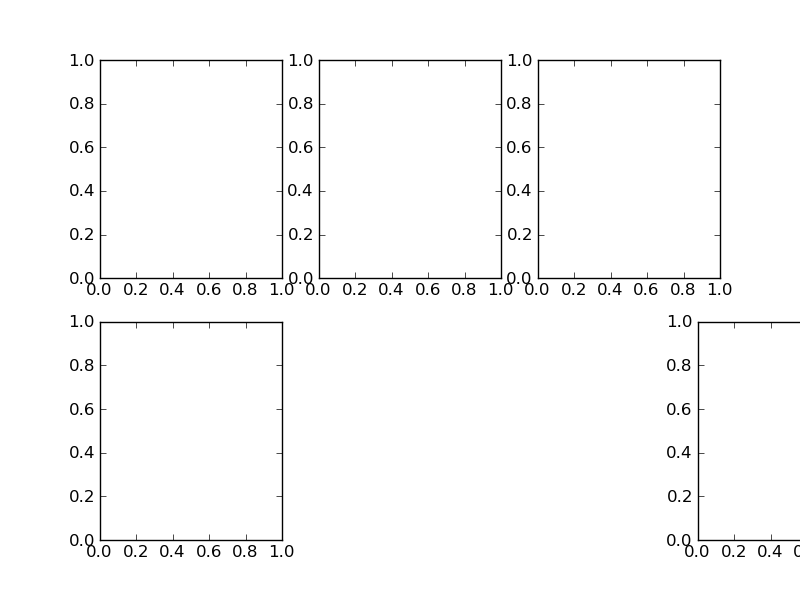
subplot 5 disappears (see 0_05_offset.png). The funny thing is that you can
keep increasing offset and subplot 6 keeps moving (see 0_20_offset.png), so
it seems that you can use Axes.set_position() to move subplots anywhere
*except* into the space formerly occupied by another subplot. Is this
correct? Is there any way around this or am I using the wrong tool for the
job? Thanks again for your help,
This looks pretty much like a bug to me, since insets should place
Axes inside of other Axes. So things should not behave that way. But
my knowledge of this part of the API is pretty low, so someone else
with better knowledge should chime in? If at least Ben agrees on that
this is a bug, please file a bug report (it's somewhere in the sf
interface I believe).
Maybe, just to make a sanity check, make an even more simple script
with only two Axes. And afaik it's possible to attach files to bug
reports, so attach that script please. And: It really appears only if
shifting the bbox of an existent Axes? It works if a new Axes is
created with the offset from the beginning (I strongly believe it
does)? Your calls look ok to me.
I'm quite short of free time currently. Poke me in about a month if
you can efford this.
I'm not sure this helps (maybe in future it'll help 
Friedrich