I am looking first at the behavior of plot with the drawstyle property
set -- let's make sure this is correct before turning to the steps
command, which just uses plot with the drawstyle set -- here is my
test code
import numpy as np
import matplotlib.pyplot as plt
fig = plt.figure()
ax = fig.add_subplot(111)
a = np.array([1,2,3,4,5])
styles = 'default' , 'steps' , 'steps-pre' , 'steps-mid' , 'steps-post'
styles = 'steps' , 'steps-pre'
for ls in styles:
ax.plot(a, ls=ls, label=ls, lw=2)
ax.legend(loc='upper left')
plt.show()
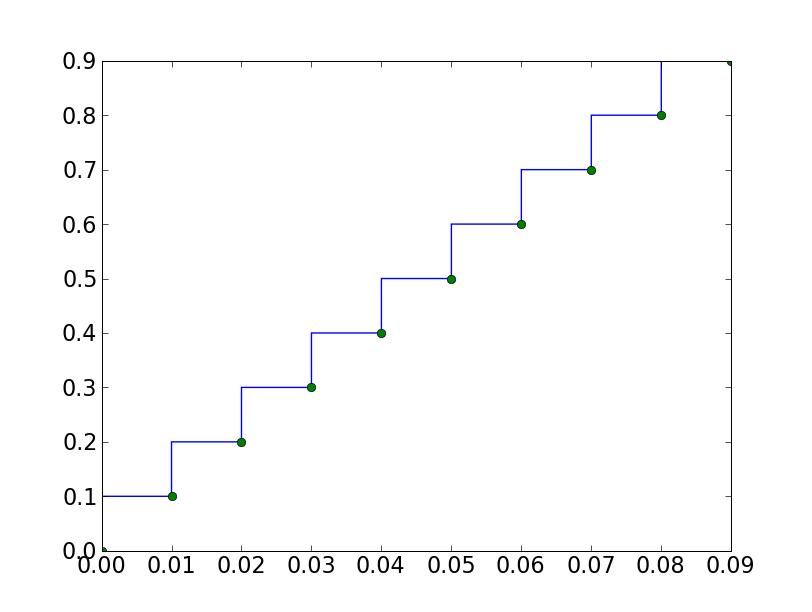
pre causes the step to rise on the x[i], post causes it to rise on
x[i+1] and mid in the middle. This seems like the correct behavior.
So it does look like the docstring for 'step' is incorrect, and I've
changed it to read
*where*: [ 'pre' | 'post' | 'mid' ]
If 'pre', the interval from x[i] to x[i+1] has level y[i+1]
If 'post', that interval has level y[i]
If 'mid', the jumps in *y* occur half-way between the
JDH
···
On Fri, Jul 17, 2009 at 5:15 PM, Paul Ray<Paul.Ray@...706...> wrote:
Ryan Krauss-2 wrote:
RTFM:
plot(t,y, drawstyle='steps-post')
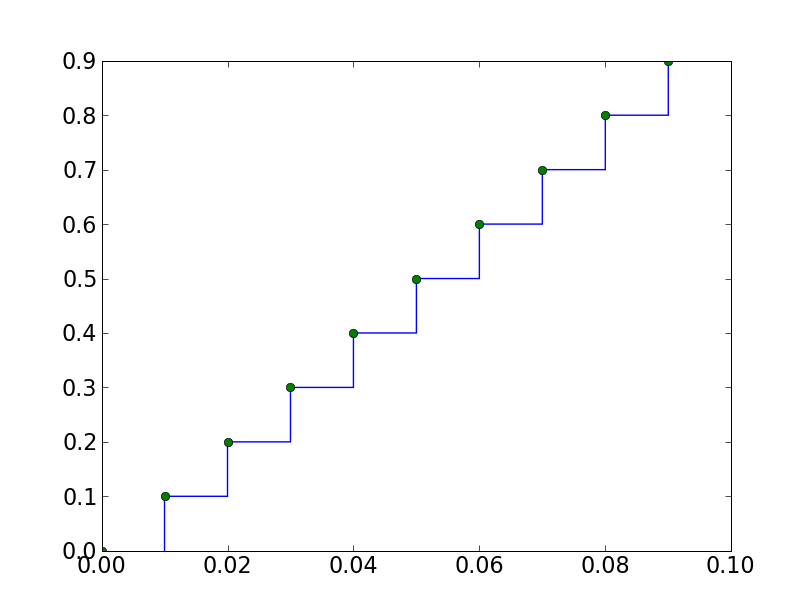
Actually, 'steps-pre' (which is the default) and 'steps-post' seem to have
swapped definitions.
Here is what the docs say:
*where*: [ 'pre' | 'post' | 'mid' ]
If 'pre', the interval from x[i] to x[i+1] has level y[i]
If 'post', that interval has level y[i+1]
If 'mid', the jumps in *y* occur half-way between the
*x*-values.
In fact both the default behavior and what you get with steps-pre are what
SHOULD happen with steps-post. And steps-post (as you point out) does what
should be the default behavior and that of steps-pre.
I have filed a bug report on this, since it is very important that this work
as expected. As the original poster pointed out, this used to work
correctly but recently seems to have gotten broken.